


Gold Warning – This is Not a Buying Opportunity
Commodities / Gold & Silver 2020 Feb 22, 2020 - 11:41 AM GMTBy: P_Radomski_CFA

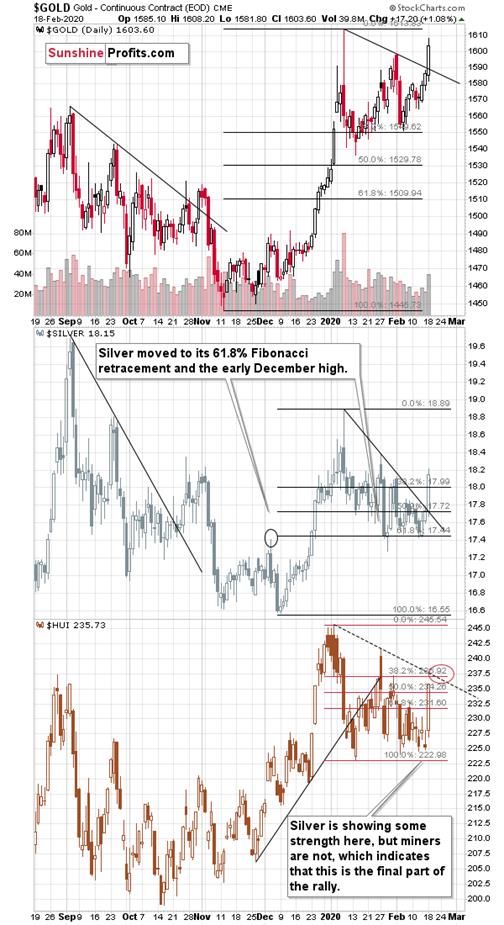
Gold rallied by $17.20 yesterday (1.08%), while silver soared by $0.42 (2.35%), which means that silver more than doubled gold’s rally. Silver is outperforming gold, which was both profitable, and informative. Gold miners moved higher even more (4.60% in case of the HUI Index), indicating that the final part of the rally is not yet over but rather that we are still in it. Alternatively, it could mean that yesterday’s session was the top, but given today’s pre-market moves higher in gold and silver, the former seems much more likely. In other words, gold and silver are likely to move higher shortly.
One question is how far are they likely to move, but the key question is how likely it is that they will indeed move higher.
At first sight, the situation is as bullish as it gets:
- the USD Index might be topping here while being very overbought from the short-term point of view
- gold, silver, and mining stocks showed exceptional strength by rallying despite USD’s rally
- gold and silver broke above their declining resistance lines
- miners showed strength and created a bullish price gap yesterday
Indeed, these are all factors that will likely make one consider jumping in the precious metals market with both feet without warm-up. Caution is warranted, though. There are also other factors and a what-if case that’s becoming increasingly important that need to be considered. While at it, take a look at the other gold trading tips to consider.
Let’s start with the last two points.
PMs in the Short-Term, Seasonality and Gold Tops
The breakouts above the declining resistance lines as well as the bullish price gap in the mining stocks are bullish, but only for the short term. In fact, they may be bullish only for the very short term. Remember the late-October breakouts and the subsequent rally? It ended the second day after the breakout.
The bullish price gaps in the mining stocks are often the starting points of big rallies, but they are also seen at the beginning of relatively insignificant upswings. For instance, the early October 2019 rally started with a bullish price gap. About 2 weeks later, miners moved to new lows.
Let’s discuss two more things before moving to the USD-related points.
First, gold’s bullish seasonality is about to become bearish.
We have only several additional days in which gold is likely to show strength based on what it used to do in the previous years. Precisely said, since it became clear that the gold’s bull market started – since 2002.
This suggests that any rally here is not likely to persist for long.
The second thing that we would like to feature, is the analogy to the previous price patterns that we saw right after gold topped on huge volume. Yes, we know that we’ve been writing about it for weeks now, but record-breaking volume in gold is so important that this is definitely justified.
The rally to or close the previous yearly high would be in perfect tune with how gold behaved after previous tops that formed on huge volume.
The three very similar cases volume-wise and volatility-wise are the September 2008 top, the 2011 top, and the early 2018 top. How did gold perform immediately after the tops?
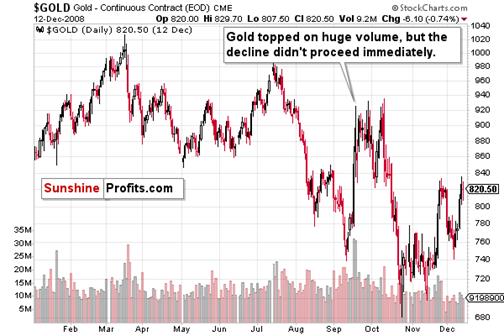
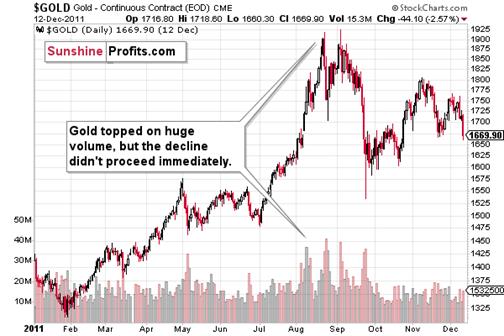
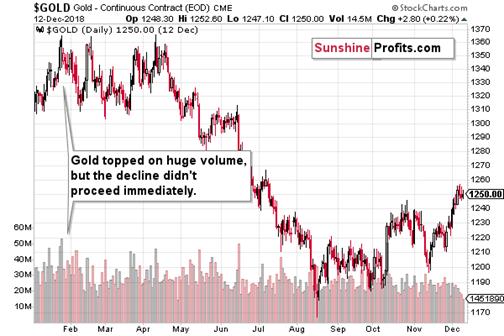
In all three cases, gold topped on huge volume, but the decline didn't proceed immediately. There was a delay in all cases and a re-test of the previous high. The delay took between several days and a few months.
Since a similar pattern followed the huge-volume tops, it seems that we might see a re-test of the recent high in the near future. Don’t get us wrong – the true rally has most likely ended, but we might see a move close to the January high, a move to it, or even a move that takes gold very insignificantly above it. That’s when people bought gold at the top in 2008, 2011, and 2018, and we don’t want you to fall for this market trick. Knowing what happened then – huge declines in the price of gold – should prevent you from buying on hope for a breakout to new highs. Oh, and by huge declines, we mean the ones where gold declined by hundreds of dollars.
This means that gold is not likely to soar very far. At the moment of writing these words, gold futures’ pre-market high is $1,612.45, which is just $0.85 below the January record-volume top.
In all three above-mentioned cases, gold’s final top formed a few dollars above its initial top. Right now, gold is practically right at its previous top, meaning that – based on the above analogy – it’s likely to rally for a few more dollars and then form a top.
Gold could get an extra boost from the , but even in this case, it’s unlikely to rally very far – at least not in light of how it used to perform after previous huge-volume coronavirus scaresessions.
Combining all the above-mentioned factors, it seems that the reversal in gold could even take place as early as today. A major news announcement could also trigger a reversal – either directly, or indirectly as the tensions subside after the news is already announced. There are several data points announced each day, but if there only was a way to check what’s particularly important for a given market… Just kidding, of course there is such a way, that’s what Paul Rejczak is doing in his Market News Reports.
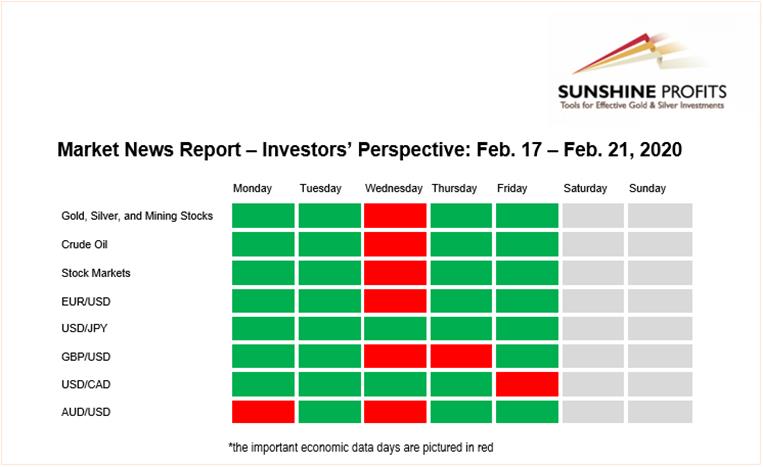
Based on this week’s issue, we see that there is only one day of the week with major news hitting the market (major meaning that they are important enough to be important also for the investors, not only for traders). The FOMC Meeting Minutes are being released today. While it may not seem that important at first sight (after all, some may say that it’s just a report on what was already decided previously), it actually is important.
It’s not just a report – it’s a report that shapes expectations of investors and traders alike. Since markets are forward looking, the expectations are of critical importance. If the Minutes manage to change people’s expectations, they will move the market.
- Ok, ok, but what about US Dollar Index? Isn’t it topping right now? Shouldn’t it make gold soar much higher?
This is where the situation gets tricky.
First, yes, based on USD’s short-term factors, it’s likely topping.
Checking on the USDX
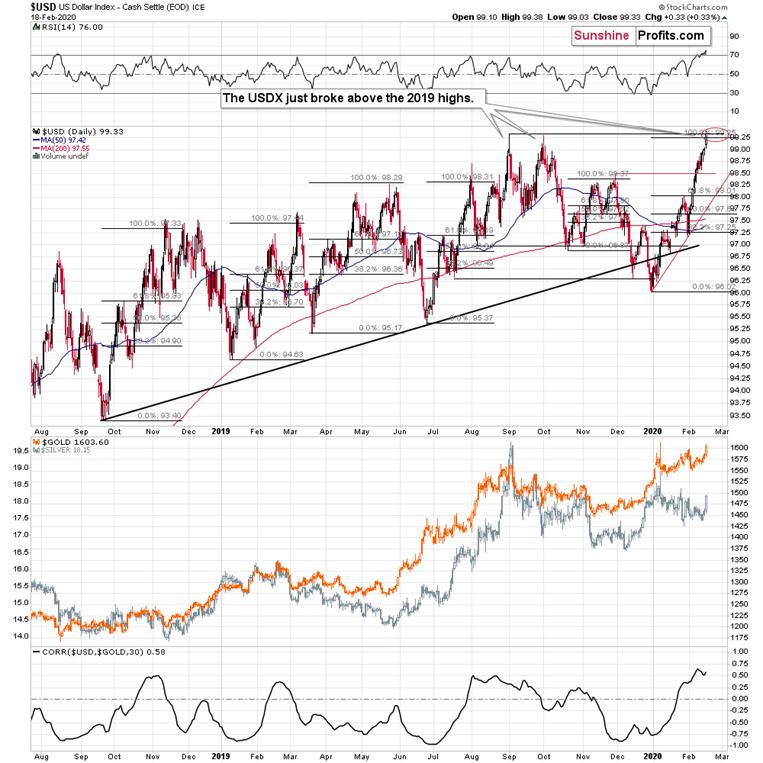
The USD Index hit our target area for this rally, it’s more overbought from the short-term point of view than it’s been since mid-2018 (at least as measured by the RSI). We saw a breakout above the 2019 highs, but the breakout was not confirmed. If it gets invalidated today, a sizable decline is likely to follow.
However, there’s more to the USD’s technical picture than just the short-term factors.
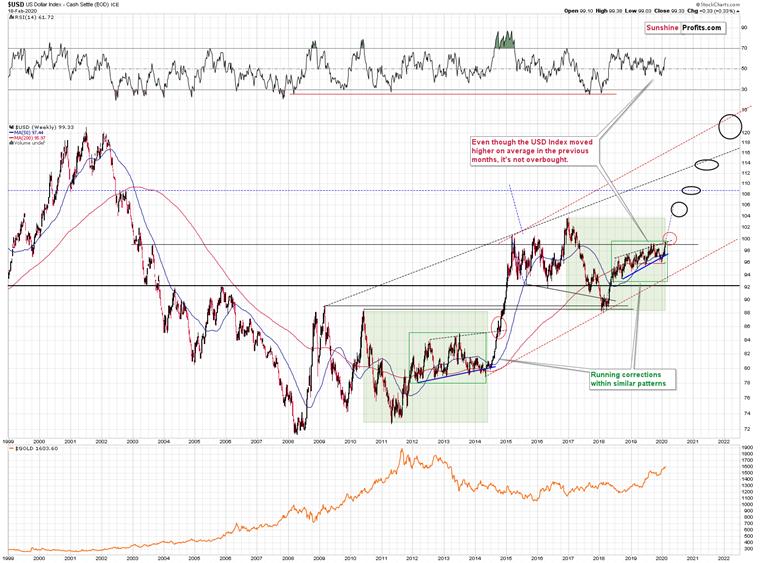
On the above long-term chart, you can see that the USD Index is not overbought from the medium-term point of view. Its pace of growth may seem unsustainable from the short-term point of view, but the above chart shows that the USDX soared at the same pace in mid-2018. And that rally didn’t stop just because it was overbought from the short-term point of view.
The USD Index is moving up in a rising trend channel (all medium-term highs are higher than the preceding ones) that formed after the index ended a very sharp rally. This means that the price movement within the rising trend channel is actually a running correction, which is the most bullish type of correction out there. If a market declines a lot after rallying, it means that the bears are strong. If it declines a little, it means that bears are only moderately strong. If the price moves sideways instead of declining, it means that the bears are weak. And the USD Index didn’t even manage to move sideways. The bears are so weak, and the bulls are so strong that the only thing that the USD Index managed to do despite Fed’s very dovish turn and Trump’s calls for lower USD, is to still rally, but at a slower pace.
The temporary breakdown below the rising blue support line was invalidated. That’s a technical sign that a medium-term bottom is already in.
Interestingly, that’s not the only medium-term running correction that we saw. What’s particularly interesting is that this pattern took place between 2012 and 2014 and it was preceded by the same kind of decline and initial rebound as the current running correction.
The 2010 – 2011 slide was very big and sharp, and it included one big corrective upswing – the same was the case with the 2017 – 2018 decline. They also both took about a year. The initial rebound (late 2011 and mid-2018) was sharp in both cases and then the USD Index started to move back and forth with higher short-term highs and higher short-term lows. In other words, it entered a running correction.
The blue support lines are based on short-term lows and since these lows were formed at higher levels, the lines are ascending. We recently saw a small breakdown below this line that was just invalidated. And the same thing happened in early 2014. The small breakdown below the rising support line was invalidated.
Since there were so many similarities between these two cases, the odds are that the follow-up action will also be similar. And back in 2014, we saw the biggest short-term rally of the past 20+ years. Yes, it was bigger even than the 2008 rally. The USD Index soared by about 21 index points from the fakedown low.
The USDX formed the recent fakedown low at about 96. If it repeated its 2014 performance, it would rally to about 117 in less than a year. Before shrugging it off as impossible, please note that this is based on a real analogy – it already happened in the past.
If the USD Index has been indeed repeating its 2010-2015 performance since 2017, then it would be likely to perform relatively similarly right now to how it performed in 2014 when it had broken above its previous highs. We marked those cases with red ellipses. Back in 2014, the USDX just pulled back sharply and then continued its massive upswing.
If that happens also shortly, the precious metals market will be likely to jump up quickly, but to plunge shortly thereafter.
The above is in perfect tune with what seems to be the most likely outcome also based on other factors that we discussed above.
This means that what we’re looking at right now (gold’s test of its January high), is very far from being an obvious buying opportunity. Conversely, it looks like the red light for gold’s decline is turning yellow and it will become green very soon.
You have been warned.
Summary
Summing up, it seems that the precious metals market is about to form a major top soon, and the easier part of this rally is already over. During the final upswing, gold might move to about $1,630, and silver might even reach its January high, at about $19.
We are preparing to enter short positions in gold, silver, and mining stocks. We will let our subscribers know manually once we want to proceed.
Thank you for reading the above free analysis. It’s part of today’s extensive Gold & Silver Trading Alert. We encourage you to sign up for our free gold newsletter – as soon as you do, you'll get 7 days of free access to our premium daily Gold & Silver Trading Alerts and you can read the full version of the above analysis right away. Sign up for our free gold newsletter today!
Thank you.
Przemyslaw Radomski, CFA
Founder, Editor-in-chief
Tools for Effective Gold & Silver Investments - SunshineProfits.com
Tools für Effektives Gold- und Silber-Investment - SunshineProfits.DE
* * * * *
About Sunshine Profits
Sunshine Profits enables anyone to forecast market changes with a level of accuracy that was once only available to closed-door institutions. It provides free trial access to its best investment tools (including lists of best gold stocks and best silver stocks), proprietary gold & silver indicators, buy & sell signals, weekly newsletter, and more. Seeing is believing.
Disclaimer
All essays, research and information found above represent analyses and opinions of Przemyslaw Radomski, CFA and Sunshine Profits' associates only. As such, it may prove wrong and be a subject to change without notice. Opinions and analyses were based on data available to authors of respective essays at the time of writing. Although the information provided above is based on careful research and sources that are believed to be accurate, Przemyslaw Radomski, CFA and his associates do not guarantee the accuracy or thoroughness of the data or information reported. The opinions published above are neither an offer nor a recommendation to purchase or sell any securities. Mr. Radomski is not a Registered Securities Advisor. By reading Przemyslaw Radomski's, CFA reports you fully agree that he will not be held responsible or liable for any decisions you make regarding any information provided in these reports. Investing, trading and speculation in any financial markets may involve high risk of loss. Przemyslaw Radomski, CFA, Sunshine Profits' employees and affiliates as well as members of their families may have a short or long position in any securities, including those mentioned in any of the reports or essays, and may make additional purchases and/or sales of those securities without notice.
Przemyslaw Radomski Archive |
© 2005-2022 http://www.MarketOracle.co.uk - The Market Oracle is a FREE Daily Financial Markets Analysis & Forecasting online publication.