


Gold-Silver Ratio Tops 100; Silver Headed For Sub-$10
Commodities / Gold & Silver 2020 Mar 21, 2020 - 01:36 PM GMTBy: Kelsey_Williams

It doesn’t seem to matter what the ratio of gold to silver is, or how high it goes. Those who prefer silver always seem to think it’s going to reverse “soon”.
It might; maybe significantly so, too. But it doesn’t mean a thing. There are no fundamental reasons for the ratio to move up or down at any given time.
Actually, there is no reason to track it, either. Except that those who love silver think it is correlated in some way with gold; its not. And that silver is cheap relative to gold (it is), so it must be a better buy (its not).
But what if there was a correlation; or inverse correlation? Shouldn’t we see something on a chart that would indicate such?
Below is a chart (source) of the gold-to-silver ratio over the past one hundred years….
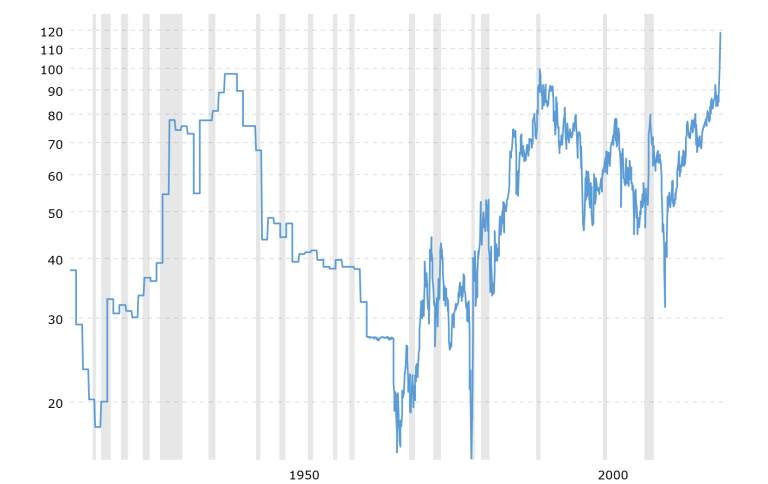
I’m not sure what positive factors the proponents of a lower ratio that favors silver see in this. What I see is a ratio that continually moves higher over time, favoring gold, since 1967.
The two extreme exceptions occurred in 1980 and 2011, when both metals peaked with a very short-lived (a few months) advantage to silver. Otherwise, there is a pattern of higher highs and higher lows which continue to favor gold.
NO HUGE DECLINE IN GOLD-SILVER RATIO
In looking at the chart, you might think there is a possibility of a repeat performance from last century when the ratio declined from 97 to 17 between 1940 and 1967. Don’t bet on it.
During that period silver was in high demand because of its industrial value. Also, the price of gold was fixed at an artificially low level.
Surprisingly enough, there a is a scenario that might result in a lower gold-to-silver ratio. Unfortunately, it involves still lower prices for both metals going forward.
I believe it is possible that the efforts of the Federal Reserve will be offset by the huge decline in all asset prices. If that is the case, then the result is deflation.
In other words, there won’t be enough dollars to go around, no matter how much QE we get. This could happen even if the Fed continues their expansive easing.
In which case, the US dollar, i.e. cash, would enjoy a longer period of relative strength. That, in turn, means a corresponding decline in the price of gold.
If the decline in gold’s price is more rapid than silver’s respective price descent, along with all other asset prices, then the ratio would decline, favoring silver.
At some point, however, silver, because it is primarily an industrial commodity, would come under more extreme pressure because of the slowdown in economic activity.
Hence, any decline in the gold-to-silver ratio from this point (it is now at 120:1 – wow!) would likely be temporary and short-lived; which is amazingly consistent with its historical pattern in the chart above.
SILVER HEADED BELOW $10
Below is another chart (source) which shows a one-hundred year history of silver prices, adjusted for inflation…
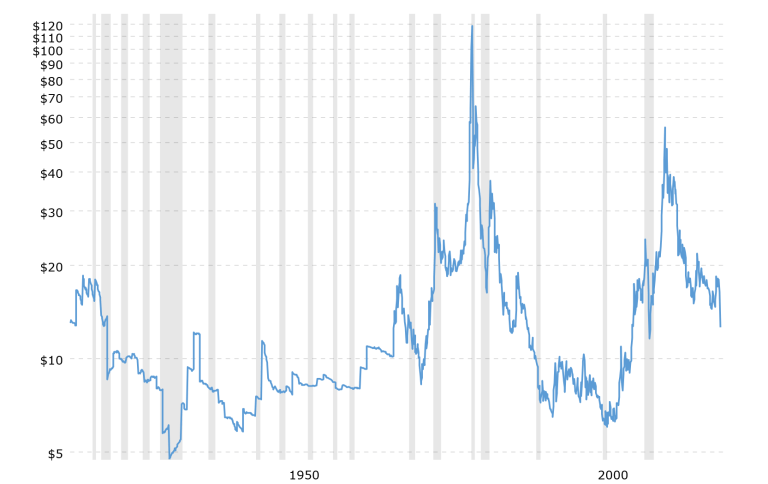
The recent 3-week decline in silver is clearly evident on the chart and is very discouraging if you are a silver bull. In fact, there is absolutely nothing to indicate higher silver prices are even remotely close.
From its intraday high of $18.91 on February 24th to its intraday low of $11.78 on March 16th, silver’s decline amounted to 38%!
It appears that silver is headed straight for familiar territory below $10 per ounce, where it could stay for several years.
I could be wrong, though. It might go lower than that and last for decades. If things get bad enough economically, such as a depression (not recession), then silver might go below $5 per ounce.
(Also see $100 Silver Has Come And Gone)
Kelsey Williams is the author of two books: INFLATION, WHAT IT IS, WHAT IT ISN’T, AND WHO’S RESPONSIBLE FOR IT and ALL HAIL THE FED!
By Kelsey Williams
http://www.kelseywilliamsgold.com
Kelsey Williams is a retired financial professional living in Southern Utah. His website, Kelsey’s Gold Facts, contains self-authored articles written for the purpose of educating others about Gold within an historical context.
© 2020 Copyright Kelsey Williams - All Rights Reserved Disclaimer: The above is a matter of opinion provided for general information purposes only and is not intended as investment advice. Information and analysis above are derived from sources and utilising methods believed to be reliable, but we cannot accept responsibility for any losses you may incur as a result of this analysis. Individuals should consult with their personal financial advisors.
© 2005-2022 http://www.MarketOracle.co.uk - The Market Oracle is a FREE Daily Financial Markets Analysis & Forecasting online publication.