


Junior Gold Miners Dangerously Close to the Cliff
Commodities / Gold and Silver Stocks 2020 Apr 25, 2020 - 05:17 PM GMTBy: P_Radomski_CFA

There are times to keep being focused on higher timeframes, yet the finer ones do send valuable signals at times too. And today, every precious metals investor better pay attention to their message. Take a look at the below chart featuring the miners.
We will compare the junior miners to what GLD ETF and SPY did. The latter are ETFs representing gold and the S&P 500.
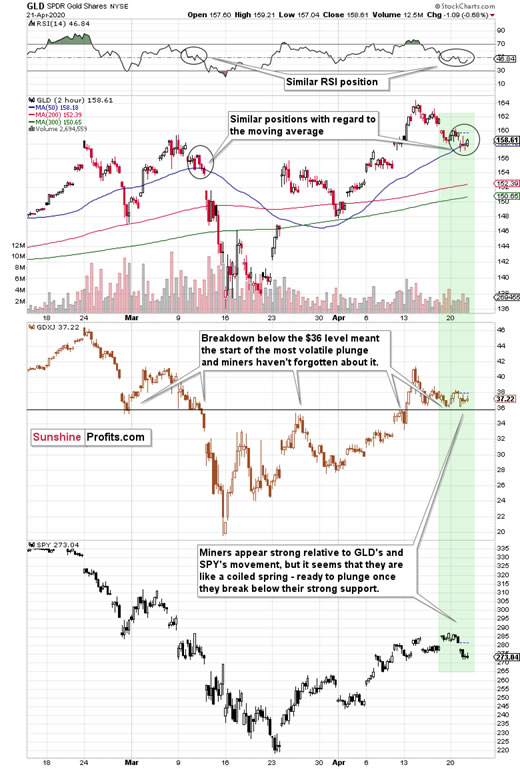
We zoomed in to the 2-hour chart to show you something specific that happened in the last few days and to provide the likely explanation for it.
Namely, the miners started to show odd strength relative to both: GLD and SPY, and we marked it with a green rectangle.
The relative strength started in the final part of the previous week, when the GDXJ approached the $36 level. Instead of falling further, just like GLD did – or at least like the SPY did on Tuesday – the GDXJ stayed above it.
The gold trading tip for today would be always question such situations before taking them at face value. Why would that be the case? What factor could have been strong enough to trigger such strength? Or maybe – in the absence of such a factor – was the mining stock sector really strong enough to withstand the powerful bearish forces in the form of declining GLD and SPY?
There is a good reason for the miners’ “strength”. It’s the $36 price level itself. Or, more precisely, the strong support that it provides.
This is the price level from which junior miners rallied in early March.
This is the price level at which juniors reversed on an intraday basis on March 9th.
This is the price level that stopped the decline on March 10th.
And this is the price level that – once broken on March 11th – triggered waterfall selling that quickly took the GDXJ below $20.
This is also the levels that stopped the late-March rally, and the level that initially served as resistance on April 9th.
It also served as support after the initial – April 15th – decline.
Given that this price level worked as both: support and resistance so many times, is it really surprising that without a major breakdown back below the previous 2020 highs in the GLD ETF, this level is holding strong?
It’s absolutely normal. Let’s not overestimate this support’s importance, though. This level doesn’t invalidate the bearish gold price forecast, it only changes its shape a bit. Instead of declining just like GLD, the GDXJ is taking a breather above $36, but once GLD moves decisively lower, the GDXJ would be likely to break below this level, and slide profoundly – catching up with the pace of the slide.
Please note what happened on April 9th and April 13th. The miners first declined (about $2) based on the resistance, but once they finally broke above the $36 level, they soared until topping almost $6 higher. What’s happening now? The GDXJ moved higher first (about $2) and as soon as it gets the bearish lead from gold, it’s likely to catch up, by breaking below the $36 level, and sliding much further.
The very same chart features a specific self-similarity suggesting that the junior miners are likely to get this kind of bearish kick shortly. Not only is the current situation in the GDXJ itself very similar to what happened in mid-March, right before the slide, and right before the breakdown below $36 – it’s also the case with the GLD ETF.
The GLD is moving back and forth around its blue moving average, while the RSI indicator (note: everything on the chart is based on the 2-hour candlesticks, not the daily candlesticks) is moving around the 50 level.
The similarity in each ETF on a stand-alone basis might just raise an eyebrow, but the fact that both similarities aligned at the same time – along with a breakdown in the general stock market and rallying USD Index – should make one’s both eyes wide open.
The next big move for the precious metals market is likely to be down, and it’s likely to be really significant.
The above article is a small sample of what our subscribers enjoy on a daily basis. Check more of our free articles on our website, including this one – just drop by and have a look. We encourage you to sign up for our daily newsletter, too - it's free and if you don't like it, you can unsubscribe with just 2 clicks. You'll also get 7 days of free access to our premium daily Gold & Silver Trading Alerts to get a taste of all our care. Sign up for the free newsletter today!
Thank you.
Przemyslaw Radomski, CFA
Founder, Editor-in-chief
Tools for Effective Gold & Silver Investments - SunshineProfits.com
Tools für Effektives Gold- und Silber-Investment - SunshineProfits.DE
* * * * *
About Sunshine Profits
Sunshine Profits enables anyone to forecast market changes with a level of accuracy that was once only available to closed-door institutions. It provides free trial access to its best investment tools (including lists of best gold stocks and best silver stocks), proprietary gold & silver indicators, buy & sell signals, weekly newsletter, and more. Seeing is believing.
Disclaimer
All essays, research and information found above represent analyses and opinions of Przemyslaw Radomski, CFA and Sunshine Profits' associates only. As such, it may prove wrong and be a subject to change without notice. Opinions and analyses were based on data available to authors of respective essays at the time of writing. Although the information provided above is based on careful research and sources that are believed to be accurate, Przemyslaw Radomski, CFA and his associates do not guarantee the accuracy or thoroughness of the data or information reported. The opinions published above are neither an offer nor a recommendation to purchase or sell any securities. Mr. Radomski is not a Registered Securities Advisor. By reading Przemyslaw Radomski's, CFA reports you fully agree that he will not be held responsible or liable for any decisions you make regarding any information provided in these reports. Investing, trading and speculation in any financial markets may involve high risk of loss. Przemyslaw Radomski, CFA, Sunshine Profits' employees and affiliates as well as members of their families may have a short or long position in any securities, including those mentioned in any of the reports or essays, and may make additional purchases and/or sales of those securities without notice.
Przemyslaw Radomski Archive |
© 2005-2022 http://www.MarketOracle.co.uk - The Market Oracle is a FREE Daily Financial Markets Analysis & Forecasting online publication.