


The Big Move In Silver May Be Right Now
Commodities / Gold & Silver 2020 May 11, 2020 - 07:35 PM GMTBy: Chris_Vermeulen

For many years now, metals traders and enthusiasts have been patiently waiting for the move in Silver that we feel its eventually going to happen.
There is almost a ritual process in the metals market that takes place when a crisis happens. We’ve written about this in a past article and we’ve highlighted how we believe Silver is one of the absolute best opportunities if/once it breaks out. It goes something like this…
A. Silver is often an overlooked “little cousin” to other precious metals like Gold and Platinum. Many traders would rather trade/acquire Gold vs. Silver.
B. When a crisis begins to happen, both Gold and Silver tend to collapse an initially as the shock to the markets translates into sales of precious metals to improve cash/margin requirements.
C. As the crisis continues to unfold, Gold will typically begin a sustained upside price move over many months where Silver may move very little to the upside. This creates a massive peak in the Gold to Silver ratio.
D. Then, suddenly Silver starts to rally upward faster than Gold and the Gold to Silver ratio begins to collapse. Gold continues to move higher throughout this process, but Silver is already rallying much stronger than Gold.
This is the breakout move in Silver that we believe may be happening right now and may continue for many months or years into the future. Allow us to explain this setup in more detail.
Before you continue, be sure to opt-in to our free-market trend signals before leaving this page, so you don’t miss our next special report & signal!
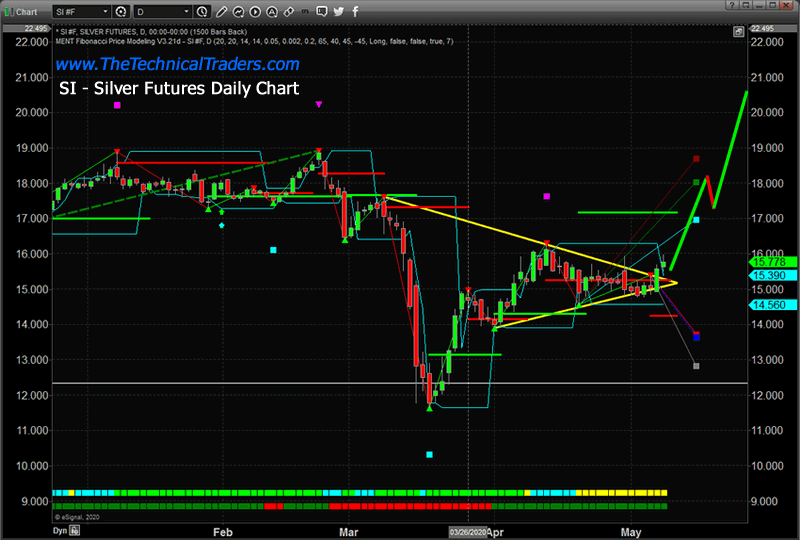
SILVER DAILY CHART
First, we believe an extended FLAG formation in Silver has recently completed and we believe this price wedge type of pattern will prompt a renewed upside price trend in Silver prices over the longer-term given a number of factors that many skilled traders have failed to appreciate. Technically, a price advance from current levels to levels above $21 will prompt a big shift in thinking for Silver traders. These new highs will suggest Silver has finally broken above the previous $20 price highs and could be skyrocketing higher as it did in 2010~12.
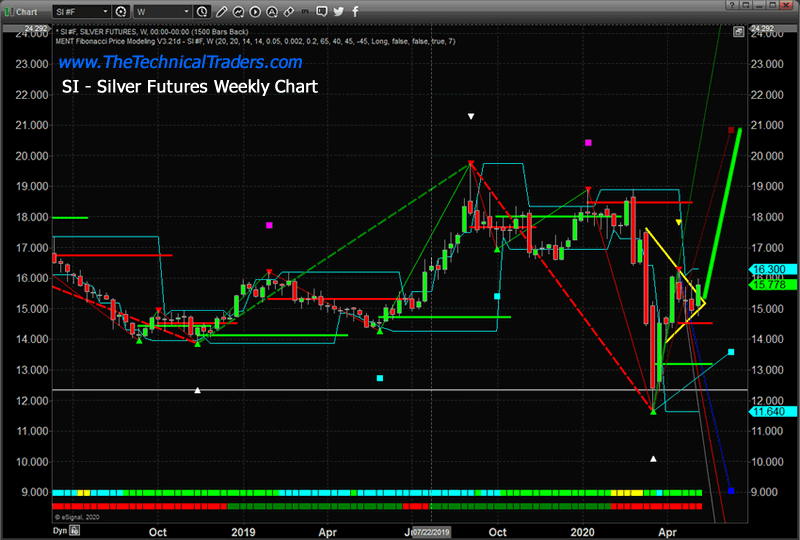
SILVER WEEKLY CHART
This Weekly Silver chart shows exactly why we believe this Flag Breakout could prompt a major upside price rally in both Gold and Silver. The downside price rotation that took place after the February 2020 global COVID-19 virus event prompted a vast rethinking of value and risk. While Gold found support fairly early, suggesting skilled traders were moving away from risk and into safe-havens, Silver has stalled below $16.50 recently. We believe this ”second-class” status for Silver is about to end in a very big way. Follow along.
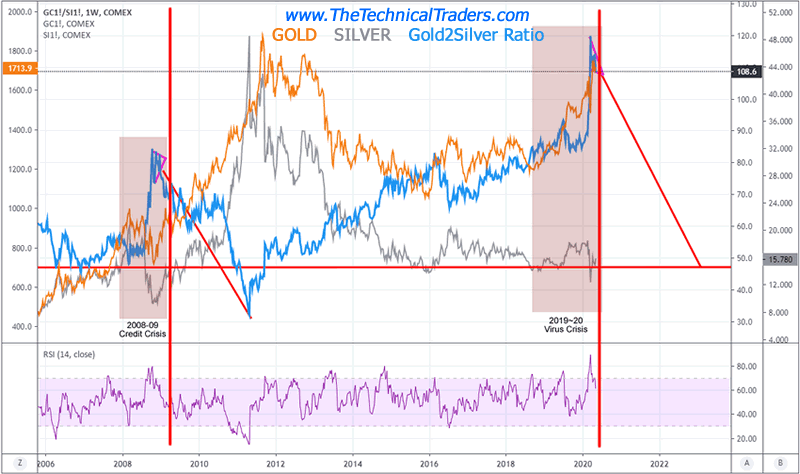
GOLD TO SILVER RATIO WEEKLY CHART
The Flag formation setup on the Daily and Weekly Silver charts is almost like the Starting Line of an incredible upward price event. The COVID-19 price collapse did what it was supposed to do, deflate expectations related to future market valuations and shift investor consideration of Metals for a short period of time. As risks accelerated and equity trades were put at risk, metals sold off as traders liquidated metals positions to cover risk exposure in Equities or another market. Now that the risk event has taken place and metals are transitioning back towards a safe-haven solution again, a new process begins – the upside advance in Gold and Silver which takes the Gold To Silver Ratio back down below 65~75.
Looking back at the 2008~09 Credit Crisis and the current COVID-19 crisis event, we can see Gold is already trading at levels which are very high compared to the peak levels in 2011 (almost 4 years after the 2008 Credit Crisis). We can also see that the Gold: Silver Ratio has reached the 120 level on this chart – which is incredibly nearly 41% higher than the peak levels in 2008. Comparatively, the Gold:Silver Ratio collapsed 60% from 2008 to 2011 while Gold skyrocketed from $720 to $1870 (259%). A similar move from current Gold price levels would suggest Gold could rally well above $4,500 over the next 2+ years.
Now, how does this relate to Silver? In 2008, Silver was trading near $9.75 just before the peak in the Gold:Silver Ratio was reached. By 2011, Silver had reached levels above $48.25 – an incredible 495% price increase. This suggests Silver could rally from current levels, near $15.75 to levels above $78 (or higher) if our analysis is correct. What are we expecting to happen next?
If our research is correct, we will see an upside price move in Silver to levels above $21 to $23 over the next three to five+ weeks. At the same time, Gold will likely rally to levels near $1999~$2100. This simultaneous price rally in both Gold and Silver should prompt the Gold:Silver ratio to stay rather elevated. But the next move in Silver, above $25~$30, should push the Gold:Silver Ratio below 100 from current high levels – which would collapse the RSI level showing us the longer-term price rally in Gold and Silver has confirmed.
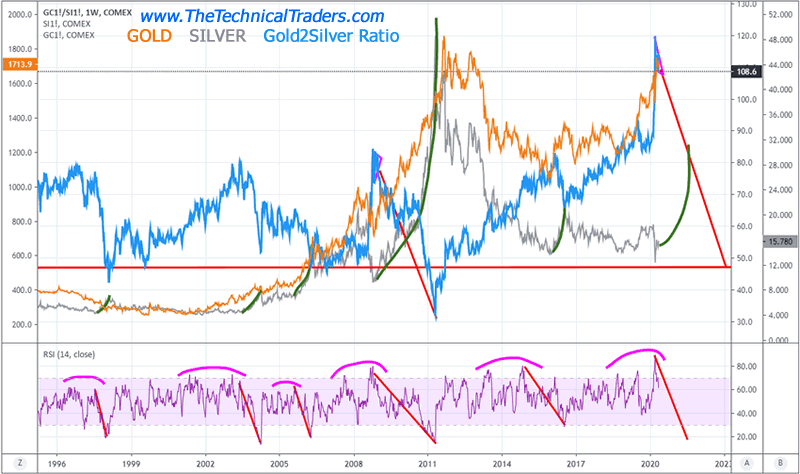
Every time the Gold:Silver Ratio collapses substantially, more than 35 to 40 RSI points after the Gold:Silver Ratio reached new high levels, this indicates a price rally in Gold and Silver is beginning. You can see how often this setup qualifies and confirms over the past 30+ years on the chart below. We’ve highlighted the uptrends in Silver in GREEN.
LONG-TERM HISTORICAL GOLD TO SILVER RATIO WEEKLY CHART
Concluding Thoughts:
We believe the current FLAG formation breakout in Silver is the beginning of a much larger upside price trend that is just beginning. Over the next few weeks and months, we believe Silver will begin an upside price advance that could last 12 to 24+ months and present an incredible opportunity for technical traders who follow price action.
If you are using our free public research for your own trading decision-making and/or using it as an opportunity to find and execute successful trades, please remember you are the one ultimately making the decisions to trade based on our interpretation and free research posts. We, as technical traders, will continue to post new research articles and content that we believe is relevant to the current market setups.
If you want to improve your accuracy and opportunities for success, then we urge you to visit www.TheTechnicalTraders.com to learn how you can enjoy our research and our members-only trading triggers (see the first chart in this article). If you are managing your retirement account or 401k, then we urge you to visit www.TheTechnicalInvestor.com to learn how to protect your assets and grow your wealth using our proprietary longer-term modeling systems. Our goal is to help you find and create success – not to confuse you.
Our researchers will generate free research on just about any topic that interests them. As technical traders, we follow price, predict future price moves, tops, bottoms, and trends, and attempt to highlight incredible setups that exist on the charts. What you do with it is up to you. Visit www.TheTechnicalTraders.com/FreeResearch/ to review all of our detailed free research posts.
In closing, we would like to suggest that the next 5+ years are going to be incredible opportunities for skilled traders. Remember, we’ve already mapped out price trends 10+ years into the future that we expect based on our advanced predictive modeling tools. If our analysis is correct, skilled traders will be able to make a small fortune trading these trends and Metals will skyrocket. The only way you’ll know which trades to take or not is to become a member.
Chris Vermeulen
www.TheTechnicalTraders.com
Chris Vermeulen has been involved in the markets since 1997 and is the founder of Technical Traders Ltd. He is an internationally recognized technical analyst, trader, and is the author of the book: 7 Steps to Win With Logic
Through years of research, trading and helping individual traders around the world. He learned that many traders have great trading ideas, but they lack one thing, they struggle to execute trades in a systematic way for consistent results. Chris helps educate traders with a three-hour video course that can change your trading results for the better.
His mission is to help his clients boost their trading performance while reducing market exposure and portfolio volatility.
He is a regular speaker on HoweStreet.com, and the FinancialSurvivorNetwork radio shows. Chris was also featured on the cover of AmalgaTrader Magazine, and contributes articles to several leading financial hubs like MarketOracle.co.uk
Disclaimer: Nothing in this report should be construed as a solicitation to buy or sell any securities mentioned. Technical Traders Ltd., its owners and the author of this report are not registered broker-dealers or financial advisors. Before investing in any securities, you should consult with your financial advisor and a registered broker-dealer. Never make an investment based solely on what you read in an online or printed report, including this report, especially if the investment involves a small, thinly-traded company that isn’t well known. Technical Traders Ltd. and the author of this report has been paid by Cardiff Energy Corp. In addition, the author owns shares of Cardiff Energy Corp. and would also benefit from volume and price appreciation of its stock. The information provided here within should not be construed as a financial analysis but rather as an advertisement. The author’s views and opinions regarding the companies featured in reports are his own views and are based on information that he has researched independently and has received, which the author assumes to be reliable. Technical Traders Ltd. and the author of this report do not guarantee the accuracy, completeness, or usefulness of any content of this report, nor its fitness for any particular purpose. Lastly, the author does not guarantee that any of the companies mentioned in the reports will perform as expected, and any comparisons made to other companies may not be valid or come into effect.
Chris Vermeulen Archive |
© 2005-2022 http://www.MarketOracle.co.uk - The Market Oracle is a FREE Daily Financial Markets Analysis & Forecasting online publication.