Potential Highs and Lows For Gold In 2020
Commodities / Gold & Silver 2020 Jun 05, 2020 - 07:19 PM GMTBy: Kelsey_Williams
DOWNSIDE POSSIBILITIES FOR GOLD PRICE
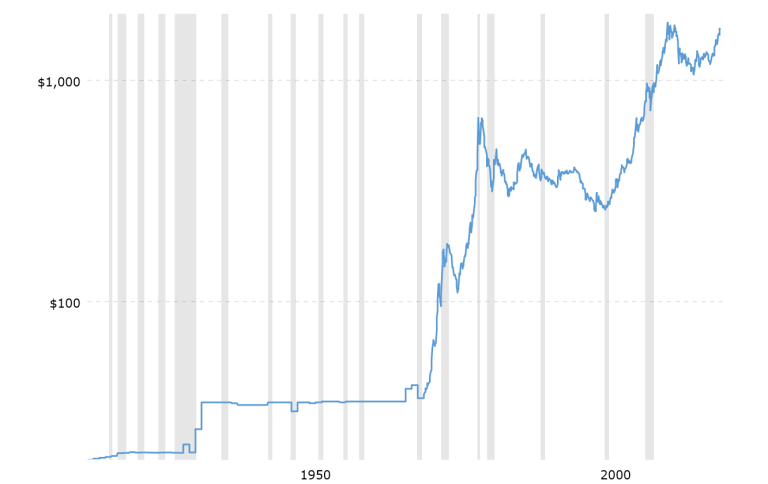
There is a correlation of gold’s increasing price relative to the declining value of the US dollar. The chart (source for all charts) below shows this inverse relationship clearly…

Over time, as the US dollar continues to lose value, the price of gold continues to increase. Seemingly, it would be worthwhile to just buy gold and wait for the inevitable decline of the dollar.
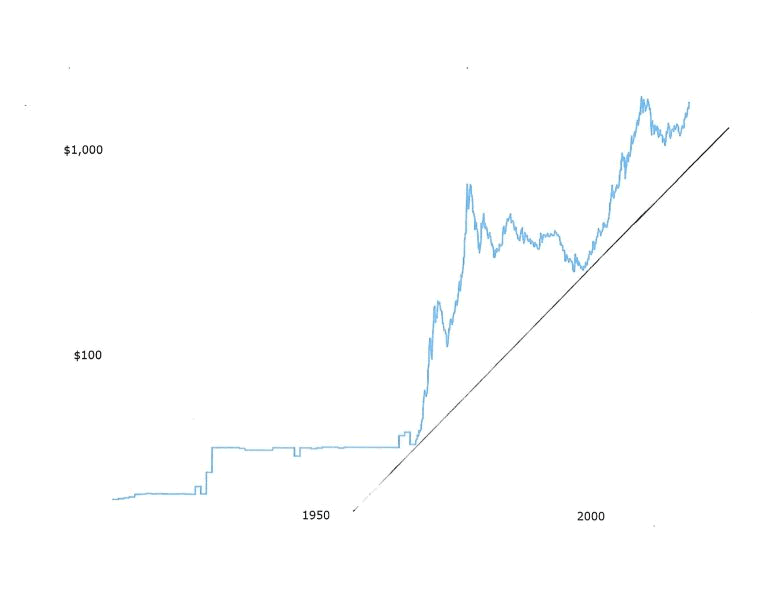
It is not that simple. Here is the same chart with a long-term uptrend line added…

The angle of the uptrend is fairly steep, yet it is possible for the gold price to fall back to as low as $1000 per ounce without violating that long-term uptrend, which dates back to 1970.
That possibility may be too extreme for most of the gold bull riders to accept, but how would you feel if gold reversed and fell back to $1400?
That is just slightly higher than where it peaked four years ago and where it broke above decisively just over one year ago.
It happens to be about halfway between the 2011 high of $1900 and the post-2011 low of $1040 in December 2015. Without getting overly technical, a fifty percent retracement in gold’s price relative to its total increase of approximately $700 since its low in December 2015 ($1750 minus $1050 = $700) puts it right at $1400. That seems to me to be a very real possibility.
Nobody really cares much about the downside, though. It’s the upside that gets the most attention, so let’s take a look at that.
UPSIDE POSSIBILITIES FOR GOLD PRICE
How high can gold go? Some say $10,000; some say as much as $25,000, maybe more. Theoretically, there is no limit to how high the price of gold can go as long as the US dollar keeps declining in value, i.e., losing purchasing power.
The Federal Reserve and the US Government are not likely to voluntarily stop inflating the money supply, so it is reasonable to expect further deterioration of the US dollar and higher gold prices over time. This would show up as a continuation of the long-term trend which is evident in both charts above.
Practically speaking, though, there are some potential limits to gold’s price rise.
Referring again to either of the charts above, we can see that the price of gold declined for twenty years between 1980 and 2000. We might be in the middle of a similar period right now; in which case, gold might be headed lower first, for several more years.
Another potential limit to higher gold prices is the threat of deflation. During deflation, the supply of dollars would shrink and the dollar would gain in value/purchasing power. Under those conditions, the price of gold would decline, reflecting new found strength for the US dollar.
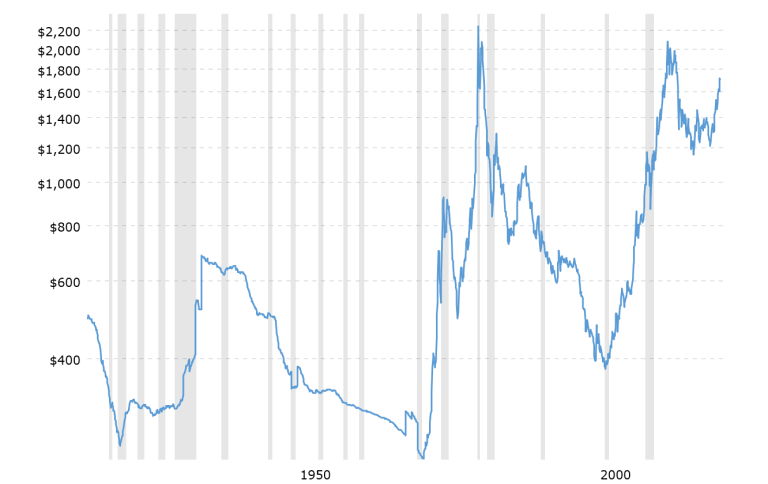
Finally, please see the chart below, which is a 100-year history of gold prices adjusted for inflation…

As you can see, the price of gold at its peak in 2011 was actually lower than its peak price in 1980 on an inflation-adjusted basis. (see Gold And The Elusive Chase For Profits)
What this means is that one ounce of gold today at $1700 has less purchasing power than one ounce of gold in 1980 at $800.
Eventually, the price of gold will approach and exceed its previous price peak from August 2011. But, in inflation-adjusted terms, it will not exceed either that peak or its 1980 high.
That is because the real value of gold is constant and unchanging. Gold is the measure of value for everything else.
No matter how high the price of gold goes, it will only be indicative of how weak the US dollar gets. And, however high that price is, gold will not exceed its previous peaks of 1980 and 2011 on an inflation-adjusted basis.
Kelsey Williams is the author of two books: INFLATION, WHAT IT IS, WHAT IT ISN’T, AND WHO’S RESPONSIBLE FOR IT and ALL HAIL THE FED!
By Kelsey Williams
http://www.kelseywilliamsgold.com
Kelsey Williams is a retired financial professional living in Southern Utah. His website, Kelsey’s Gold Facts, contains self-authored articles written for the purpose of educating others about Gold within an historical context.
© 2020 Copyright Kelsey Williams - All Rights Reserved Disclaimer: The above is a matter of opinion provided for general information purposes only and is not intended as investment advice. Information and analysis above are derived from sources and utilising methods believed to be reliable, but we cannot accept responsibility for any losses you may incur as a result of this analysis. Individuals should consult with their personal financial advisors.
© 2005-2022 http://www.MarketOracle.co.uk - The Market Oracle is a FREE Daily Financial Markets Analysis & Forecasting online publication.


