Gold Sector Correction is Maturing
Commodities / Gold & Silver 2020 Jun 20, 2020 - 02:30 PM GMTBy: Gary_Tanashian
Gold Stock Seasonal Average
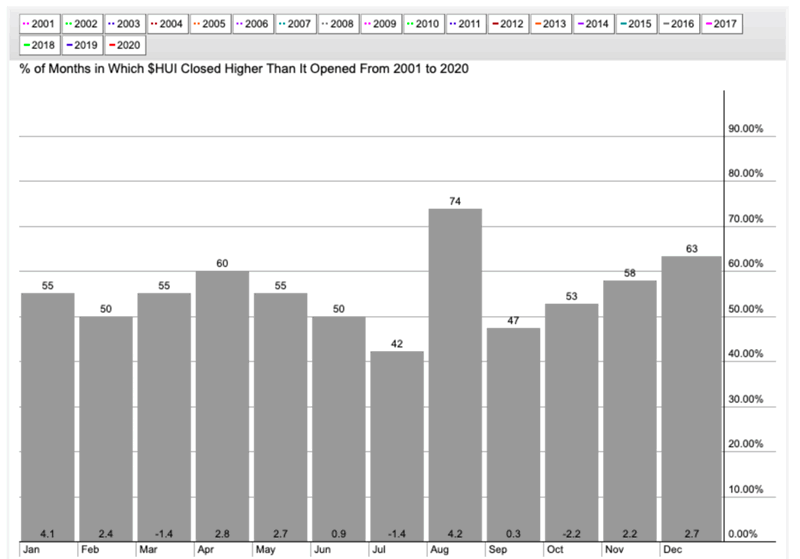
The HUI Gold Bugs index has over the last 2 decades (encompassing both bull and bear markets) tended to bottom in July per stockcharts.com‘s data for the index. A seasonal average is not a directive, but it is a () guide to be factored. Last year gold stocks bottomed in May as we caught what would be a violent upswing. This year I expect the low to be in June or July.

Why Gold?
As the stock market’s broad relief rally lumbers on, drawing the ire of bears that think it should be otherwise, a chorus of dissenting voices is blaming legions of shut-in Millennials and their Robinhood trading accounts for the excess. Maybe that plays a small part.
But here I’ll repeat that the Fed is balls out printing money (really funny munny), manipulating Treasury and Corporate bonds and stating that it will have virtually no limits in this MMT (I would turn around MMT to call it what it actually is, TMM or Total Market Manipulation). They can give it a fancy name like Modern Monetary Theory but by any other name it is chicanery and a scam that society will suffer the fallout from some day.
They are cheapening the munny units in order to give the appearance of rising asset (especially stock asset) units. Say it again… “they are cheapening the munny units in order to give the appearance of rising asset units.”
Hence, gold. The shiny rock, the bullion, the anchor to monetary sanity. In this surreal monetary realm it is something real.
The goal of investing in or trading the gold mining sector is to capitalize on the desperate actions of monetary and fiscal policymakers vs. gold’s stability. Last week we covered a lot of details: Gold Stock Correction and Upcoming Opportunity. No need to repeat the details. People who know how to play this sector have been patiently managing the correction (whether that means selling into it, buying during it, being psychologically prepared for it, etc.) and planning for its end.
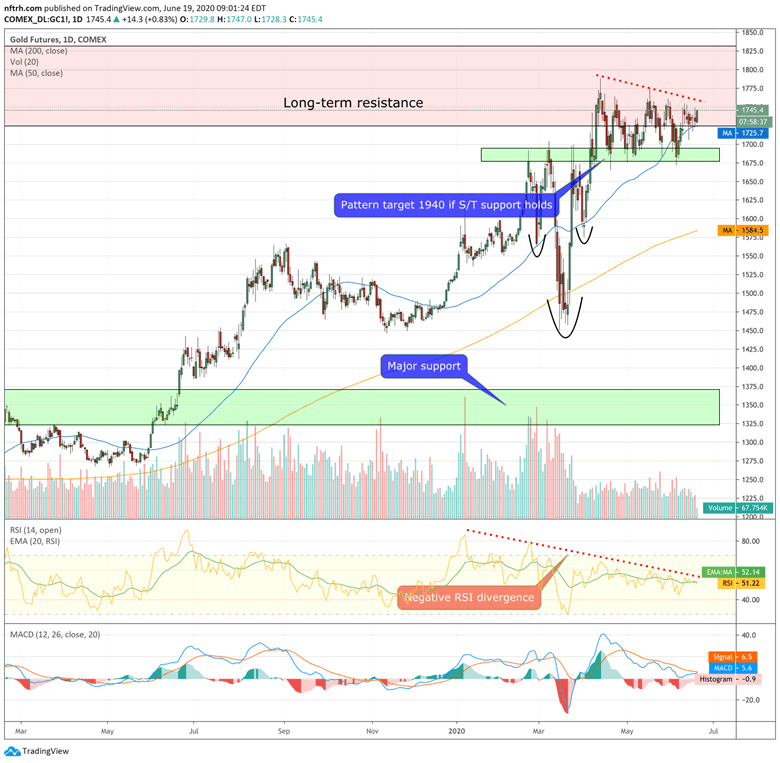
We keep a long list of quality miners, explorers and royalty charts updated every week in NFTRH for this very outcome; an end to the correction and the next phase of gold’s bull market, which it is consolidating now, per this daily futures chart. If the negative RSI divergence does not resolve into a sharp drop soon it is going to then be big time fuel for what could be a hysterical run up to the 1940 target and possibly beyond.
Gold had become over-loved by financial refugees in March. They are now buying stocks again.* That is perfect because they should not be aboard the next phase. Their role will again be to knee-jerk and chase later on. Despite the consolidation since March, the daily chart (via TradingView) shows a completely intact situation at the up trending 50 day average.

Gold/SPX Ratio
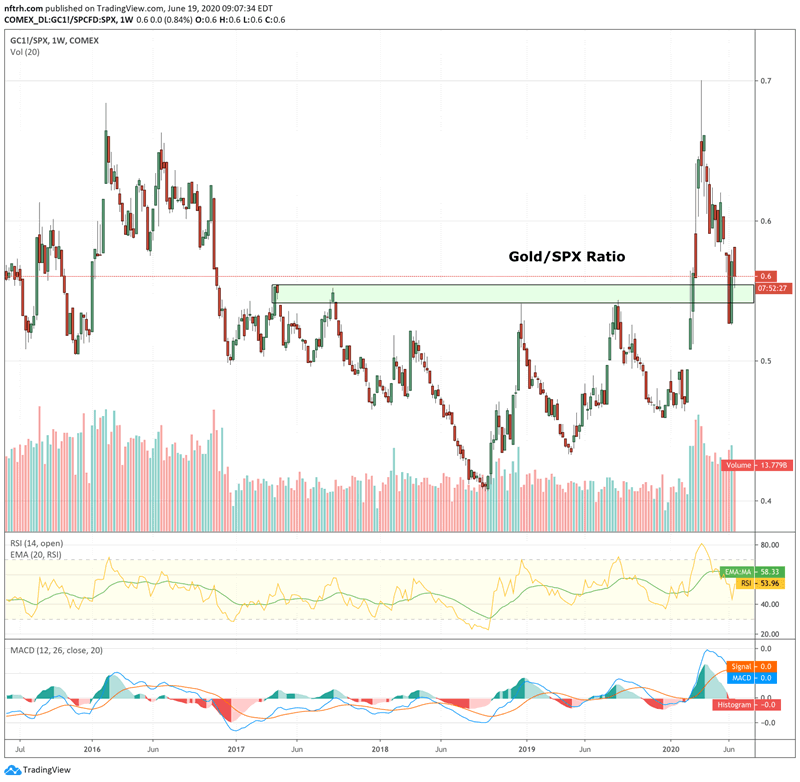
I’ll leave you with one final chart. There has been a reason gold has under-performed the stock market since the terror of early spring. That reason is because cyclical asset markets are and have been on a massive sentiment relief rally and sentiment will do what it will do in the short-term. Just remember that simple fact when you see the inevitable rationale like this that certain interests will try to feed you: Here Come the Golden Ghost Stories.
Gold/SPX has done a great job of taking out the excess while remaining intact. 5 year chart…

The Not So Great Reset
Lunatics far and wide talk about something called “The Great Reset” but that too is tin foil, whether aspects of it are true or not. It does not help your market management to have that crap in your head. Instead, let’s boil down the picture to the gold sector and realize that as the terror stricken sentiment of March and April is being reset, so too is the over-enthusiastic sentiment in the gold sector.
The next bull phase should be arriving before long.
* I have been selectively long the stock market since March as well, but very aware of the gathering risks, which I personally and the NFTRH service manage accordingly.
Subscribe to NFTRH Premium (monthly at USD $33.50 or a 14% discounted yearly at USD $345.00) for an in-depth weekly market report, interim market updates and NFTRH+ chart and trade setup ideas, all archived/posted at the site and delivered to your inbox.
You can also keep up to date with plenty of actionable public content at NFTRH.com by using the email form on the right sidebar and get even more by joining our free eLetter. Or follow via Twitter ;@BiiwiiNFTRH, StockTwits or RSS. Also check out the quality market writers at Biiwii.com.
By Gary Tanashian
© 2020 Copyright Gary Tanashian - All Rights Reserved
Disclaimer: The above is a matter of opinion provided for general information purposes only and is not intended as investment advice. Information and analysis above are derived from sources and utilising methods believed to be reliable, but we cannot accept responsibility for any losses you may incur as a result of this analysis. Individuals should consult with their personal financial advisors.
Gary Tanashian Archive |
© 2005-2022 http://www.MarketOracle.co.uk - The Market Oracle is a FREE Daily Financial Markets Analysis & Forecasting online publication.


