


Gold and Oil: Be Aware of the "Spike"
Commodities / Gold & Silver 2020 Jul 22, 2020 - 04:34 PM GMTBy: EWI

"Hope and fear look different on a chart"
Recently in these pages, we noted that bull markets in stocks tend to end with "a subtly slowing ascent" rather than with a final "spike" higher, as many investors believe. Historical examples were provided.
It was also pointed out that, by contrast, commodities do tend to end major uptrends with a price spike.
The Wall Street classic book, Elliott Wave Principle: Key to Market Behavior, by Frost & Prechter explains why (keep in mind regarding the quote from the book that fifth waves are the final wave in the main trend of a financial market):
Fifth wave advances in the stock market are propelled by hope, while fifth wave advances in commodities are propelled by a comparatively dramatic emotion, fear; fear of inflation, fear of drought, fear of war. Hope and fear look different on a chart, which is one of the reasons that commodity market tops often look like stock market bottoms.
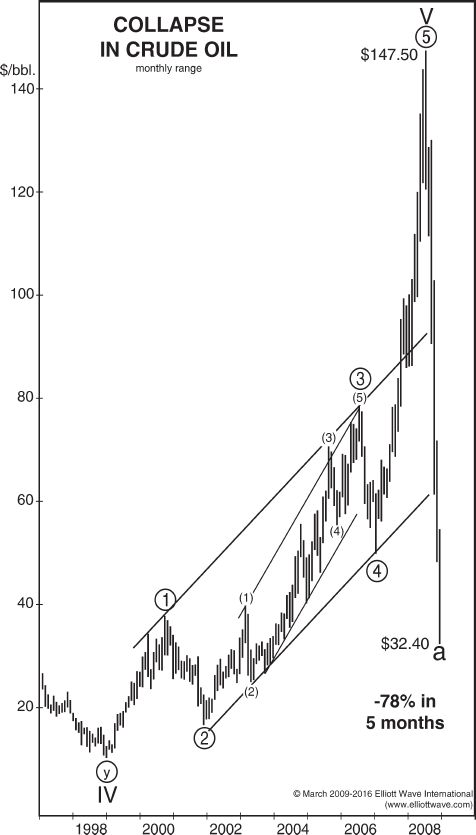
Crude oil offers a prime historical example. This chart shows the big spike higher going into the July 2008 high. A dramatic 78% plunge in just five months followed:
Of course, precious metals are also commodities. Thus, the price history of gold offers another historical example of a price spike going into a peak.
This chart and commentary are from the Sept. 2, 2011 Elliott Wave Financial Forecast, a monthly publication which provides analysis of major U.S. financial markets:
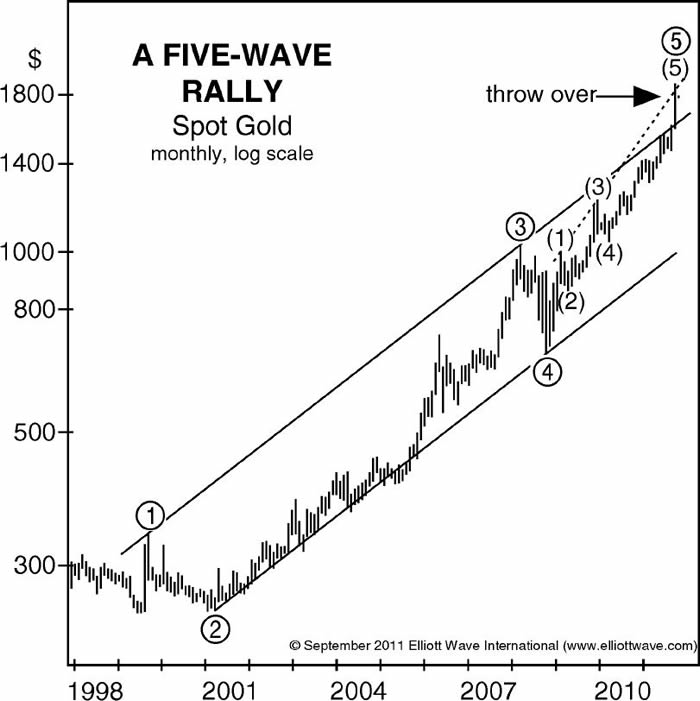
Commodity fifth waves in major rallies often end in a final spike higher. ...
Gold's wave structure is consistent with a terminating rise.
Four days after that chart published, on Sept. 6, 2011, a headline in the British newspaper, The Guardian, said:
Gold hits new high as fear stalks financial markets
There we have that word "fear" again.
On that date, the yellow metal hit a high of $1921.50 and a big decline followed. By December 2015, gold was trading at $1046.20.
Now, let's return to the topic of crude oil -- a market that's seen extraordinarily dramatic moves in 2020, as you probably know.
This chart from the April 2020 Elliott Wave Financial Forecast shows when Elliott Wave International's analysts made key calls on the crude oil market in recent history:
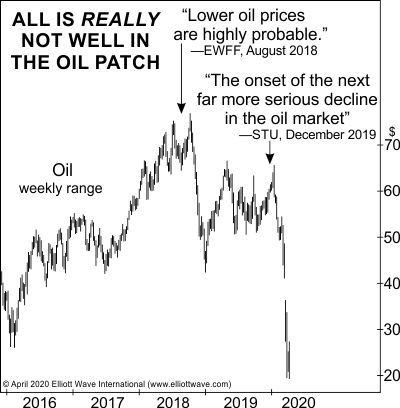
You can see the junctures at which the Elliott Wave Financial Forecast and the U.S. Short Term Update prepared Elliott Wave International's subscribers for declines.
As the April Elliott Wave Financial Forecast noted:
The chart shows crude oil's recent plunge. When we've felt the time was right to make comments on oil's prospects, we've done so, as shown on the chart. Our last comment was in December 2019. Since January of this year, oil futures have crashed 71%.
Of course, the volatility in the crude oil market continued thereafter.
How would you like to get insights into the "forecasting tool" which EWI's analysts employ?
You can do so -- 100% free -- via a valuable resource titled "The Forecasting Tool That Called Every Major Turn in Crude Oil Since 1993."
Simply join Club EWI (membership is also free) and this video becomes instantly available to you. Club EWI is the world largest Elliott wave educational community.
Get started by following this link: "The Forecasting Tool That Called Every Major Turn in Crude Oil Since 1993."
This article was syndicated by Elliott Wave International and was originally published under the headline Gold and Oil: Be Aware of the "Spike". EWI is the world's largest market forecasting firm. Its staff of full-time analysts led by Chartered Market Technician Robert Prechter provides 24-hour-a-day market analysis to institutional and private investors around the world.
© 2005-2022 http://www.MarketOracle.co.uk - The Market Oracle is a FREE Daily Financial Markets Analysis & Forecasting online publication.