


A Tale of Two Precious Metal Bulls
Commodities / Gold & Silver 2020 Aug 12, 2020 - 06:02 PM GMTBy: Richard_Mills

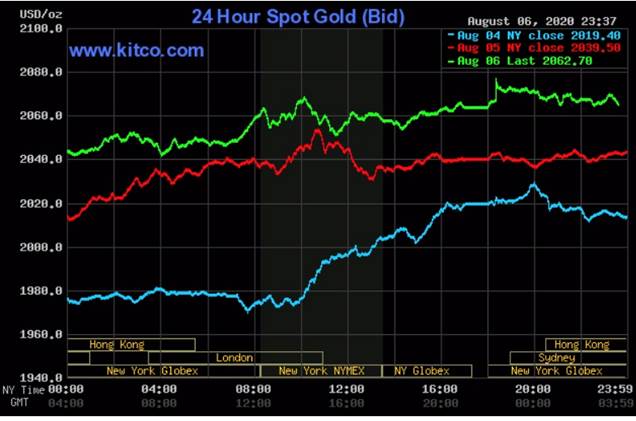
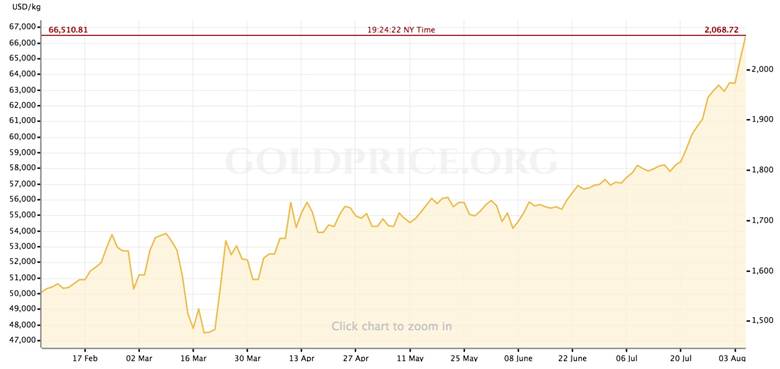
This week gold prices have smashed one record after another, well surpassing the previous high set in 2011, of $1,920 an ounce.
At time of writing, spot gold’s last bid was $2,064.10.
The usual suspects are behind the surge, ie., worrisome covid-19 infections, geopolitical concerns especially US-China tensions over trade (President Trump tried to force China-owned TikTok into selling its US operations) and the South China Sea, fears of inflation on the back of unlimited monetary stimulus, and low interest rates worldwide.
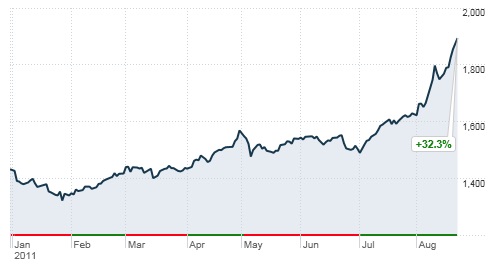
Bullion prices have climbed more than 30% year to date, as investors choose gold as a safe haven amid widespread economic uncertainty created by the pandemic. They believe gold will hold its value better than other assets such as stocks and bonds.
How much higher can gold go? Bank of America raised its 18-month target price to US$3,000 an ounce, due to dovish central bank policies; Goldman Sachs analysts have their eye on $2,300, based on similar concerns over currency debasement. The influential bank believes a weaker dollar will boost the purchasing power of major gold consumers in emerging-market (EM) economies like China and India.
We wanted to know, what could send prices higher?
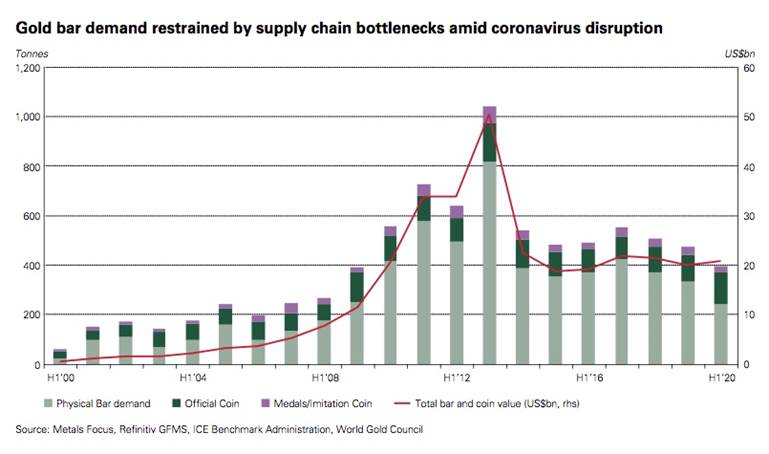
One factor that hasn’t been given much press, is the demand for physical bullion, ie. gold bars and coins. Does a comparison of physical demand during gold’s 2011 run, to that of the current record-setting surge, tell us anything about future prices?
As a matter of fact, it does.
In 2011, gold prices established a base of around $1,500 in April 2011, before climbing into the $1,800s in August, and briefly breaching $1,920 that month.
This year, prices based themselves at about $1,700, also in April, then began surging due to the coronavirus and the economic fallout from it, including record-low bond yields and central bank monetary easing that has piled up US debt to record-high levels. We know from previous articles that gold prices and debt to GDP ratios strongly correlate.
While investment demand for gold in the first halves of both 2011 and 2020 was strong, propelling prices higher, the components of that demand were different.
In 2011, investment demand in the first quarter grew 26%, but fell 37% to 359.4 tonnes in Q2. Without covid-19 to contend with, the main factor driving gold investment in the first half of 2011, was bar and coin sales, which shot up 52% in the first quarter, and 9% in the second. The buying mostly took place in China, which doubled its demand to 90 tonnes.
Oddly, ETFs didn’t play much into investment demand in the buildup to $1,900 nine years ago. The first quarter experienced net outflows of 56 tonnes, as investors took profits.
A price correction in January 2011 prompted investors to buy the dip, with many choosing to do so by purchasing gold bars and official gold coins like American Eagles.
In 2020, the pandemic has been the main influence on the gold market, dragging down consumer demand for gold in the form of bars, coins and jewelry, but providing massive support for ETF investments. Something interesting about the current gold run, is the fact it has been able to set records despite the pandemic severely crimping physical demand.
In the first six months of this year, total investment demand for gold, including gold ETFs, bars and coins, reached an all-time high of 1,130.7 tonnes, valued at a record $60 billion.
“Many countries remained under lockdown restrictions in Q2,” the World Gold Council said. “This took its toll on bar and coin demand, even as the gold price rallied, reaching successive eight-year highs in U.S. dollar terms and breaking new records in many other currencies.”
ETFs accelerated in Q2, taking H1 inflows to a record-breaking 734t.
On Monday, Aug. 3, worldwide gold-backed exchange-traded funds gained 3,365 tons, more gold than Germany holds and second only to the US government, which holds 8,000 tons.
ETF strength has offset weakness in other sectors.
As gold shops and refineries were forced to either close or reduce staff/ hours, bar and coin investment fell sharply in the second quarter of 2020, leading to a 17% decline in first-half demand to 396.9 tonnes - an 11-year low.
The World Gold Council report noted a divergence in investor behavior between East and West. Many gold holders in Asia and the Middle decided to sell their bullion and take profits whereas in Europe and North America, bar and coin demand saw “substantial growth”.
In April, Bloomberg reportedthe coronavirus pandemic has frozen the Chinese gold market, torpedoing demand at a time when investors elsewhere in the world are clamoring for the safety of bullion.
China is the biggest buyer of gold bars, coins and jewelry, but the national shutdown to contain the virus has emptied malls…
By contrast, in North America and Europe, business was booming, despite the difficulty in securing gold products due to the closure of some mints and refineries.
In April, the managing director of BullionByPost, the UK’s largest online bullion trader, reported sales of gold coins increasing five-fold. European investors amassed 137.4t of gold bars and coins in the first half of the year – the highest H1 total since 2010.
In the second quarter, bar and coin demand in the US more than quadrupled to 13.8t, resulting in a near- trebling of H1 demand to 29.3t.
For retail investors wanting to get their hands on some bullion, it doesn’t look like it’s going to get any easier. The US Mint has reportedly reduced the supply of gold and silver coins, as it takes measures to prevent the coronavirus from spreading among its employees.
The agency says production of all coinage, from loose change to commemorative/ investment coins made of gold, silver, platinum and palladium, will be affected for the next 12 to 18 months.
Conclusion
It’s interesting to observe the effects of the pandemic on gold markets. On the one hand, the uncertainty surrounding covid-19 and all of the economic fallout from it, has driven investors into the arms of gold like never before. There are record inflows into gold-backed ETFs, seen by many investors as the best way to play the rally.
On the other hand, government-imposed covid-19 restrictions have made it hard to buy physical gold - bars, coins and jewelry. In this way it is remarkable to see investment demand for gold surging, and record prices being recorded, despite a lot of would-be gold buyers simply unable to make a purchase.
Comparing the current rally with the one in 2011 is instructive, in that it shows the pent-up demand for physical gold. Consider: in the first half of 2011, bar and coin demand was 673 tonnes. During the first half of 2020, bar and coin demand was 396 tonnes. In other words, demand for gold bars and coins in 2020’s run would have to increase another 8.90 million ounces of gold, to match the amount of investment-grade physical gold demanded in the run-up to the last big gold run of 2011.
As countries continue to relax their coronavirus restrictions, we see a gradual return to physical buying, particularly in China and India, resulting in the next leg up for gold prices.
Could gold’s price climb another US$1,000.00 to Bank of America’s US$3,000.00 target? Its my opinion, because of all the reasons listed above, gold’s bull run is going to continue for a while yet, and that bodes well for AOTH’s gold focused juniors to continue their runs or be acquired by a major/mid-tier miner.
But what of silver? Silver hit US$50.00 an ounce when gold was US$1,900.00. Today with gold at + US$2,050.00, silver, despite a nice pop recently, is lagging golds last record-breaking run currently sitting at just US$28.61 an ounce. Imo silvers got some serious running to do just to play catch-up. If B of A’s call on $3,000.00 gold is right, my thinking is silver blows right thru $50.00.
By Richard (Rick) Mills
If you're interested in learning more about the junior resource and bio-med sectors please come and visit us at www.aheadoftheherd.com Site membership is free. No credit card or personal information is asked for.
Richard is host of Aheadoftheherd.com and invests in the junior resource sector. His articles have been published on over 400 websites, including: Wall Street Journal, Market Oracle, USAToday, National Post, Stockhouse, Lewrockwell, Pinnacledigest, Uranium Miner, Beforeitsnews, SeekingAlpha, MontrealGazette, Casey Research, 24hgold, Vancouver Sun, CBSnews, SilverBearCafe, Infomine, Huffington Post, Mineweb, 321Gold, Kitco, Gold-Eagle, The Gold/Energy Reports, Calgary Herald, Resource Investor, Mining.com, Forbes, FNArena, Uraniumseek, Financial Sense, Goldseek, Dallasnews, Vantagewire, Resourceclips and the Association of Mining Analysts.
Copyright © 2020 Richard (Rick) Mills - All Rights Reserved
Legal Notice / Disclaimer: This document is not and should not be construed as an offer to sell or the solicitation of an offer to purchase or subscribe for any investment. Richard Mills has based this document on information obtained from sources he believes to be reliable but which has not been independently verified; Richard Mills makes no guarantee, representation or warranty and accepts no responsibility or liability as to its accuracy or completeness. Expressions of opinion are those of Richard Mills only and are subject to change without notice. Richard Mills assumes no warranty, liability or guarantee for the current relevance, correctness or completeness of any information provided within this Report and will not be held liable for the consequence of reliance upon any opinion or statement contained herein or any omission. Furthermore, I, Richard Mills, assume no liability for any direct or indirect loss or damage or, in particular, for lost profit, which you may incur as a result of the use and existence of the information provided within this Report.
© 2005-2022 http://www.MarketOracle.co.uk - The Market Oracle is a FREE Daily Financial Markets Analysis & Forecasting online publication.