Key Gold Ratios to Other Markets
Commodities / Gold & Silver 2020 Sep 23, 2020 - 10:18 AM GMTBy: Gary_Tanashian
Views of gold in relation to other markets and brief summaries thereof, with a focus on how it relates to the gold mining sector and the inflationary macro to come.
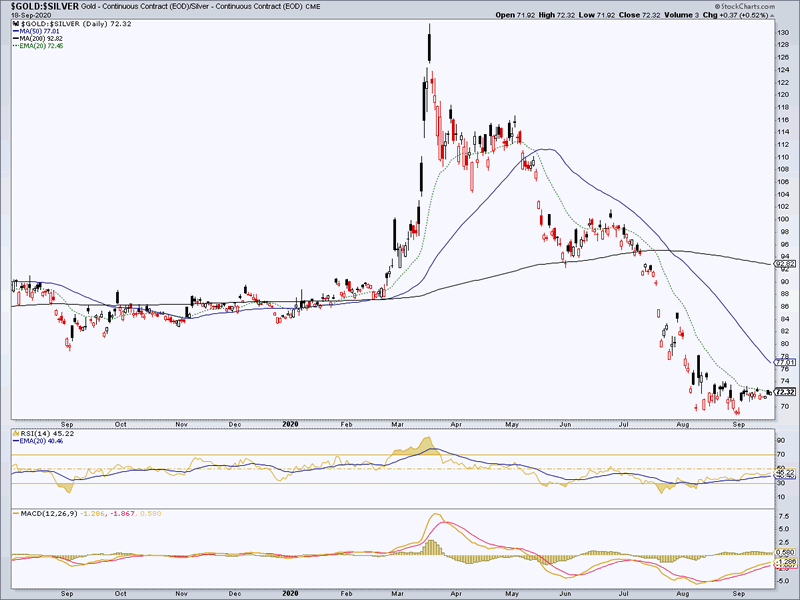
Gold/Silver Ratio
Gold/Silver is in a potential bounce pattern with RSI and MACD positive divergences. A bounce (if applicable) – which would likely come in unison with a counter-trend bounce in USD could accompany more broad market pressure and possibly a brief whiff of deflation. As we’ve noted in NFTRH for much of 2020, silver has trounced gold and that is a bigger picture inflationary signal in the “metallic credit spread” (H/T Bob Hoye).
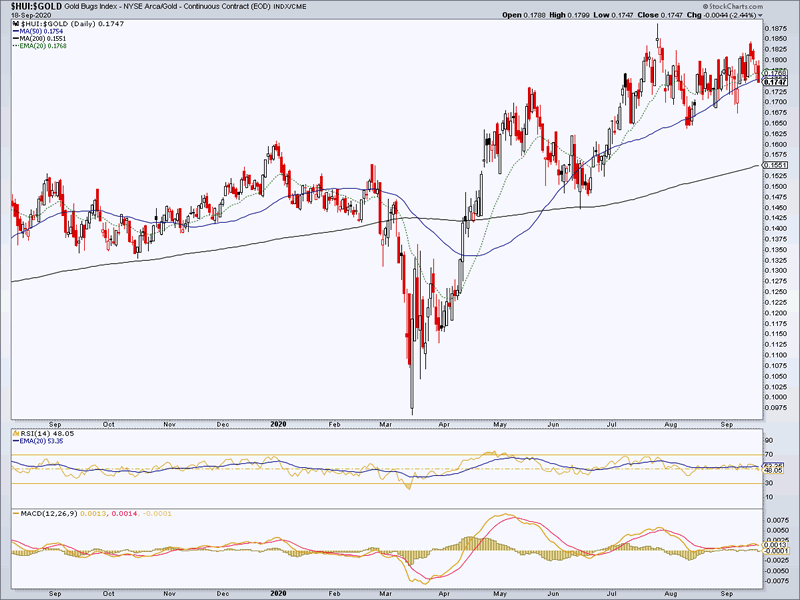
HUI/Gold Ratio
Let’s flip it over for a moment and use gold as the caboose. HUI/Gold ratio is intact to its intermediate uptrend, although it got a little heavy on the rising 50 day moving average to end the week. If it holds up, it’s still a bullish indicator. If it fails the SMA 50 we’d be looking at a deeper sector correction, although the major trend would still be intact at the SMA 200.
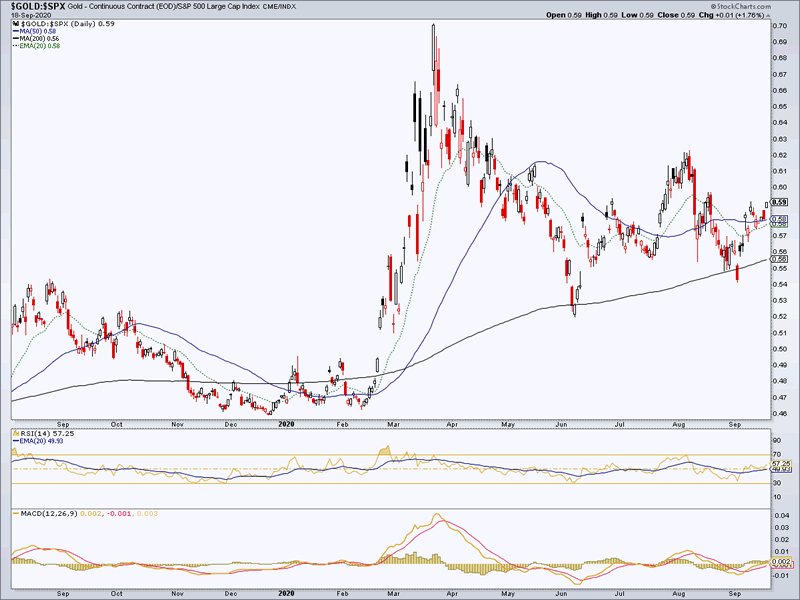
Gold/SPX Ratio
Currently an excellent macro fundamental indicator for gold stocks, as Gold/SPX held a higher low on a second test of the rising 200 day moving average and looks constructive to reestablish the uptrend.
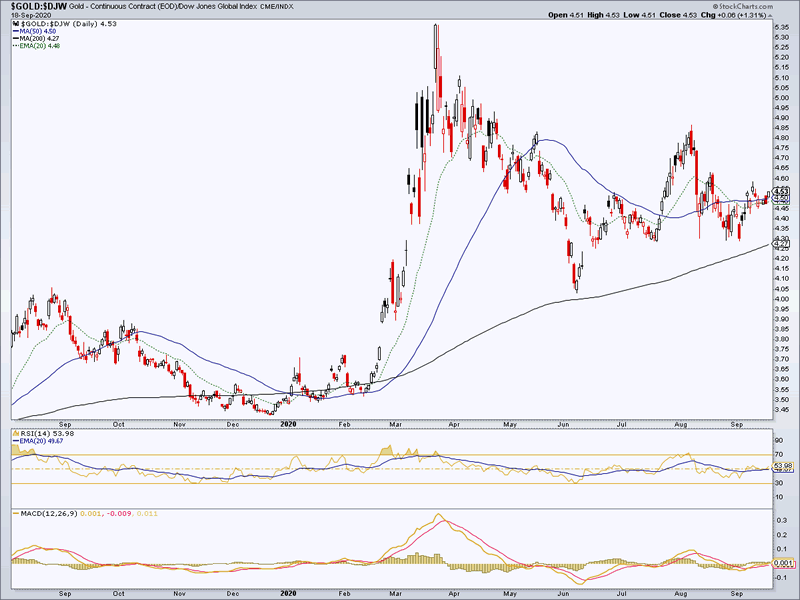
Gold/DJW
Gold/Global Stock Markets is very similar to Gold/SPX above. Constructive.
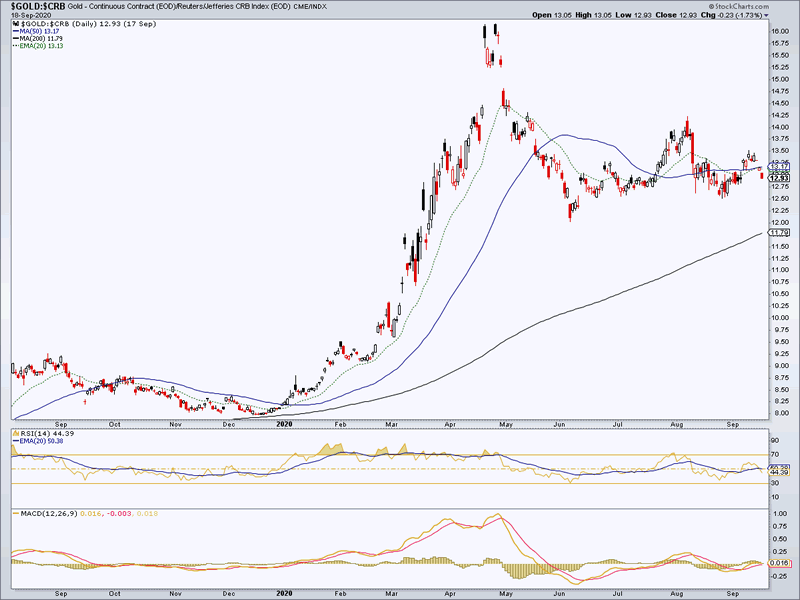
Gold/CRB Ratio
A little wobbly to end the week as crude oil bounced. A breakdown in Gold/Commodities, much like Gold/Silver, could have inflationary implications. But the major trend by the 200 day moving average, remains up.
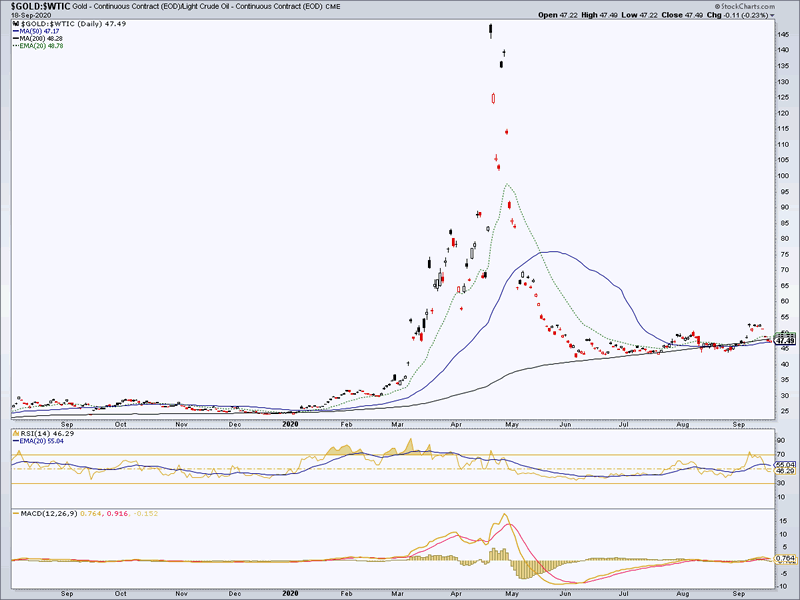
Gold/Oil Ratio
This is a highly volatile but up trending inter-market ratio that smooths out as a fundamental positive for gold miners in 2020 (energy being a significant piece of the mining cost pie).
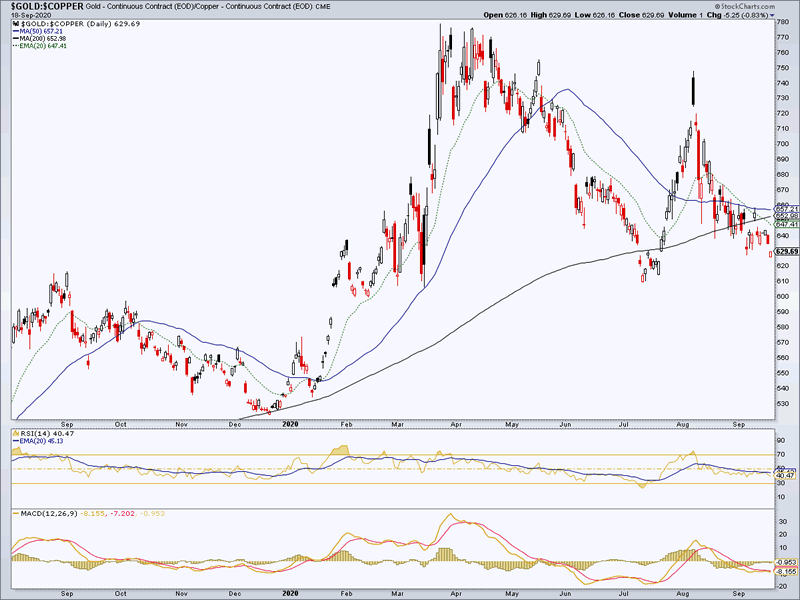
Gold/Copper Ratio
A breakdown in Au/Cu and gold’s ratios to other cyclical industrial metals would not necessarily mean the end for gold and gold stocks. Quite the contrary most likely. But it would indicate the dawn of an inflationary cyclical macro, within which the gold sector would be “just another sector” in the inflated macro, as we often note. In NFTRH we have been identifying some opportunities in the commodity sphere, but a breakdown (below the July low) here would indicate more to come.
Bottom Line
As is usually the case, gold followed by gold stocks and silver have led the macro markets to an inflationary juncture. This happened in 2001, in grand fashion in Q4 2008 and in minor fashion again in 2016. This year gold has again led out of a deflation scare and its ratios to other markets will indicate when the inflation will kick in as a readily obvious condition.
Subscribe to NFTRH Premium (monthly at USD $33.50 or a 14% discounted yearly at USD $345.00) for an in-depth weekly market report, interim market updates and NFTRH+ chart and trade setup ideas, all archived/posted at the site and delivered to your inbox.
You can also keep up to date with plenty of actionable public content at NFTRH.com by using the email form on the right sidebar and get even more by joining our free eLetter. Or follow via Twitter ;@BiiwiiNFTRH, StockTwits or RSS. Also check out the quality market writers at Biiwii.com.
By Gary Tanashian
© 2020 Copyright Gary Tanashian - All Rights Reserved
Disclaimer: The above is a matter of opinion provided for general information purposes only and is not intended as investment advice. Information and analysis above are derived from sources and utilising methods believed to be reliable, but we cannot accept responsibility for any losses you may incur as a result of this analysis. Individuals should consult with their personal financial advisors.
Gary Tanashian Archive |
© 2005-2022 http://www.MarketOracle.co.uk - The Market Oracle is a FREE Daily Financial Markets Analysis & Forecasting online publication.


