Silver Junior Miners Reach Flag Apex Just Before US Elections
Commodities / Gold & Silver 2020 Nov 02, 2020 - 04:52 PM GMTBy: Chris_Vermeulen
Heading into what will likely become one of the biggest events in American political history on November 3, the US stock markets are holding up quite well on Monday, November 2. My team and I have published a number of articles recently suggesting we believe wild price swings and increased volatility is to be expected before and after the US elections. We have even suggested a couple of stock trades that we believe should do fairly well 60+ days after the elections are complete. Right now, we want to bring your attention to the Silver Junior Miners ETF (SILJ).
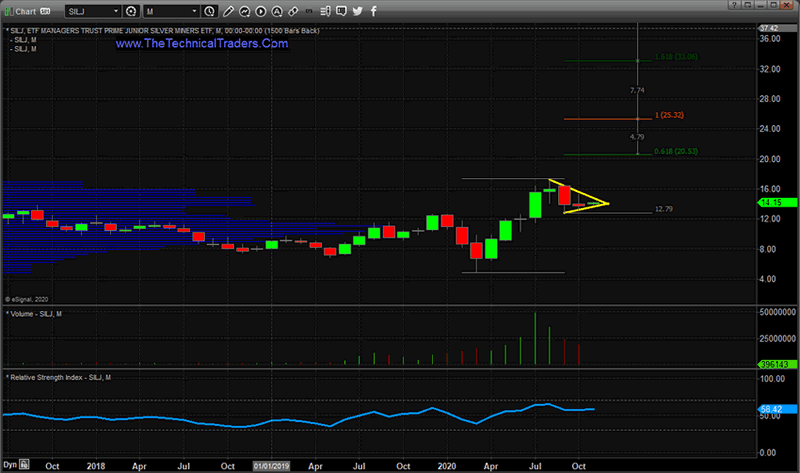
The current Pennant/Flag formation that is setting up in SILJ on the following Monthly chart has peaked our attention. Diminishing volume and moderately strong support above the $12 price level suggest key resistance near $15.05 will likely be retested as metals and miners continue to attract safe-haven capital after the elections. The Apex of the Pennant/Flag formation appears to be nearly complete – a breakout or breakdown move is pending. We believe the uncertainty of the elections will prompt a possible breakout (upside) price trend in the near future.
When we apply a Fibonacci price extension (100% measured move) to the rally from the COVID-19 lows to the recent highs and extend that range from the September 2020 lows, we can identify a $20.35 and $25.32 upside price target for any potential breakout move.

The key to understanding the potential of this setup is to ask yourself if you believe an increased wave of fear and uncertainty will exist shortly after the US elections and to ask yourself if the renewed surge in COVID-19 cases will drive investors away from stocks and into safe-haven investments? If you believe this is true, then metals and miners should be on your radar.
One thing we would like to make very clear to you is that metals and miners tend to contract as stock markets collapse. This is an impulse contraction in price because of risks and fear, but it is very real. From July 2018 to June 2019, SILJ contracted almost 40%. This is an important risk component to consider when reviewing the current setup in SILJ. In July through August 2018, the price of silver was kept down given that that the US Federal Reserve continued to raise interest rates – eventually prompting a -20% price collapse in the SPY starting near October 1, 2018. SILJ lead this move lower and didn’t actually bottom until June 2019 – when the SPY had recovered to near all-time highs. Thus, this setup in SILJ does include a fairly strong measure of risk for any moderate downside move if the markets fall precipitously after the US elections.
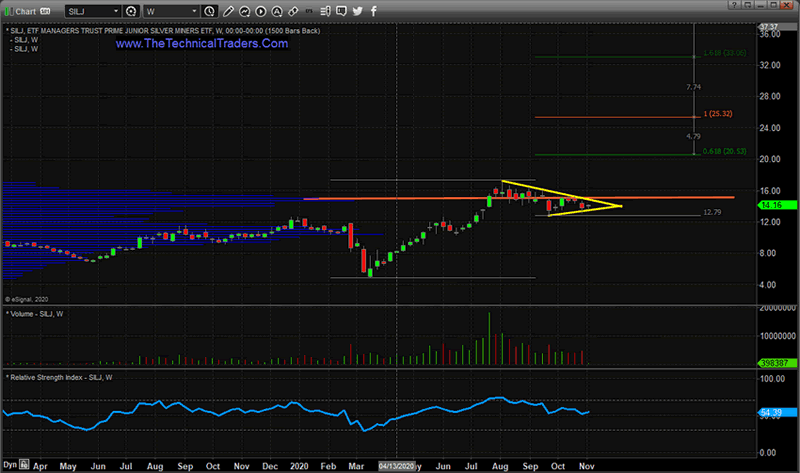
This Weekly SILJ chart, below, highlights what we believe is a clear breakout resistance level near $15.05. Our research team believes that this critical resistance level, once breached, will likely prompt a moderately strong upside price trend in SILJ. Failure to breach this level will likely result in a continued flagging price formation attempting to retest the $11.00 support levels.

Please review the data we’ve provided within this research post before making any decisions. There is a moderately high degree of risk associated with this current Pennant/Flag setup. Having said that, we do believe that a breakout or breakdown move is very close to initiating and we believe the critical level to the upside is the $15.05 resistance level. Traders should understand and acknowledge the risks associated with this setup, and also understand that any breakdown price event could be moderately dangerous with quick price action to the downside.
We believe there are a number of great opportunities setting up in the markets right now. Various sectors and price setups have caught our attention – this SILJ setup being one of them. We believe the next 6+ months will present some great trading opportunities for those individuals that are willing to “wait for confirmation” of the trade entry. The one thing we’ve tried to make very clear within this article is this “setup” is not a trade entry trigger. There is far too much risk at this point for us to initiate any entry or trade, and we will make the call to trade once we have the signals we seek. Confirmation of this trade setup is pending – but it sure looks good at this point.
If you want to survive trading these markets then you learn fairly quickly how important it is to protect against risk and to properly size your trades. My research team and I are here to help you find better trades and navigate these incredibly crazy market trends. We can also help you preserve and even grow your long-term capital with our signals that tell you when long-term trends are starting and ending. Don’t wait until it is too late – find out more at www.TheTechnicalTraders.com.
Chris Vermeulen
www.TheTechnicalTraders.com
Chris Vermeulen has been involved in the markets since 1997 and is the founder of Technical Traders Ltd. He is an internationally recognized technical analyst, trader, and is the author of the book: 7 Steps to Win With Logic
Through years of research, trading and helping individual traders around the world. He learned that many traders have great trading ideas, but they lack one thing, they struggle to execute trades in a systematic way for consistent results. Chris helps educate traders with a three-hour video course that can change your trading results for the better.
His mission is to help his clients boost their trading performance while reducing market exposure and portfolio volatility.
He is a regular speaker on HoweStreet.com, and the FinancialSurvivorNetwork radio shows. Chris was also featured on the cover of AmalgaTrader Magazine, and contributes articles to several leading financial hubs like MarketOracle.co.uk
Disclaimer: Nothing in this report should be construed as a solicitation to buy or sell any securities mentioned. Technical Traders Ltd., its owners and the author of this report are not registered broker-dealers or financial advisors. Before investing in any securities, you should consult with your financial advisor and a registered broker-dealer. Never make an investment based solely on what you read in an online or printed report, including this report, especially if the investment involves a small, thinly-traded company that isn’t well known. Technical Traders Ltd. and the author of this report has been paid by Cardiff Energy Corp. In addition, the author owns shares of Cardiff Energy Corp. and would also benefit from volume and price appreciation of its stock. The information provided here within should not be construed as a financial analysis but rather as an advertisement. The author’s views and opinions regarding the companies featured in reports are his own views and are based on information that he has researched independently and has received, which the author assumes to be reliable. Technical Traders Ltd. and the author of this report do not guarantee the accuracy, completeness, or usefulness of any content of this report, nor its fitness for any particular purpose. Lastly, the author does not guarantee that any of the companies mentioned in the reports will perform as expected, and any comparisons made to other companies may not be valid or come into effect.
Chris Vermeulen Archive |
© 2005-2022 http://www.MarketOracle.co.uk - The Market Oracle is a FREE Daily Financial Markets Analysis & Forecasting online publication.


