


Using Stock Market Comparison Analysis For An Edge
Stock-Markets / Stock Market 2022 Apr 27, 2022 - 05:28 PM GMTBy: Chris_Vermeulen

Multi timeframe, as well as comparison analysis, have many benefits. As traders, we tend to utilize the shorter-term time frames to enter our trades and place our stops. But the BIG money is made from gleaning information from the longer-term charts. We would classify long term as monthly or weekly while short term would be a daily or 4-hour time frame.
Comparison analysis can be done by comparing different time periods or we can see how our market is trading vs another highly correlated market.
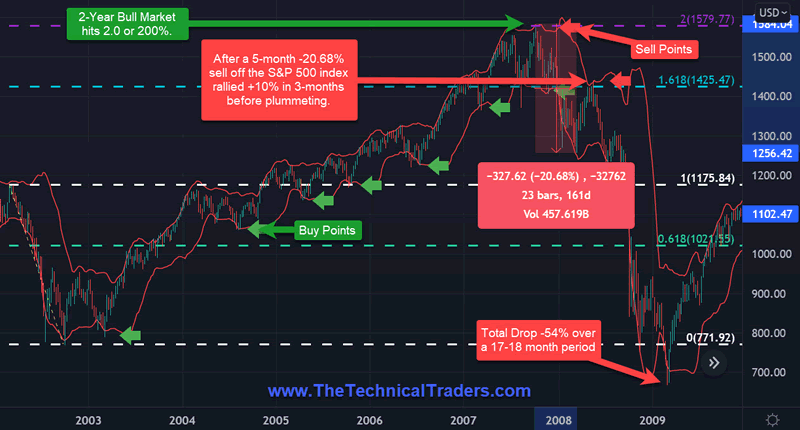
Since we have a lot of subscriber interest in stocks, we thought it might be time to compare the current chart of the SPY to the S&P 500 index during the 2002-2009 period. The S&P 500 weekly chart experienced a nice bull market with several buy points from 2002 up to 2007.
S&P’s 2007 top occurred at its 2.0 or 200% extension of its 2002 high vs low. Then about 5-months later sold off a little over -20%. After hitting the key -20% psychological end-of-bull-market area the S&P rallied for several weeks up to its 1.618 overhead resistance. Then after turning back down at the 1.618 the S&P lost approximately -50% of its value. The complete drop occurred over a 17–18-month period from peak to trough.
2002-2009 SPX • S&P 500 INDEX CFD • WEEKLY • TRADINGVIEW
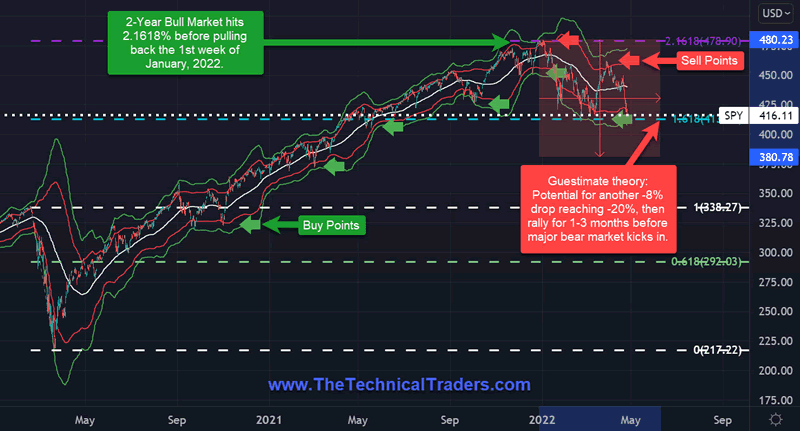
SPY VULNERABLE TO ANOTHER -8% DOWN BEFORE STAGING A DEAD-CAT BOUNCE!
The SPY is down approximately -12 to -13% from its peak for 2022. It is feasible the SPY could fall another -8% or reach -20% before it stages some type of rally into late summer or early fall. If this scenario plays out, we should then prepare for what could be a significant drop or bear market in the 4th quarter of 2022 that could extend into 2023 and beyond.
The 2007 top of the S&P 500 index occurred at 2.0 or 200% of its previous major high-low swing low. The 2022 top for the SPY also occurred at 2.1618 or 200% of its Covid high-low swing low.
The potential exists for the SPY to pull back -20% from its peak before staging a temporary rally to a lower distribution top.
2020-2022 SPY • SPDR S&P 500 ETF TRUST • 4-HOUR • TRADINGVIEW
USD CONTINUES TO MOVE HIGHER
We are now seeing that major economies (US/UK/Japan) are not immune from global deleveraging and inflation. Investors have been seeking safety in the US Dollar and this may eventually trigger a broader and deeper selloff in U.S. stocks. As the USD continues to strengthen corporate profits for US multinationals will begin to disappear.
Especially in times like these, traders must understand where opportunities are and how to turn this knowledge into profits. Part of what we do at www.TheTechnicalTraders.com is to distill price action into technical strategies and modeling systems. These assist us in understanding when opportunities exist in the US stock market and specific sector ETFs. Our core objective is to protect our valuable capital while identifying suitable risk vs reward opportunities for profits in new and emerging trends.
A CANARY IN THE COAL MINE – BERKSHIRE HATHAWAY
Around 1911, miners would carry canaries into coal mines to give them an advanced warning of danger. This phrase or analogy is also utilized by traders in the financial markets. Our canary or canaries would simply be a market or stock that might give us an indication that there is a problem with the overall market or that the global equity markets are shifting from a bull to a bear.
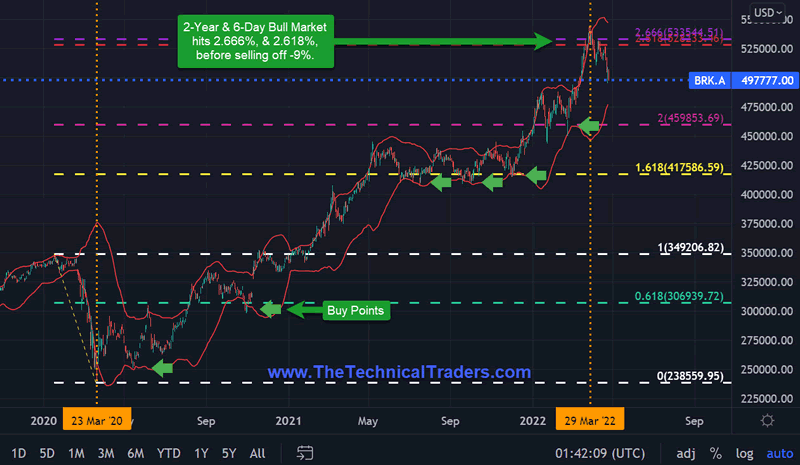
Berkshire Hathaway BRK.A (NYSE) founded and operated by famed Warren Buffet is a diversified holding company that owns subsidiaries that engage in insurance, freight rail transportation, energy generation, and distribution, services, manufacturing, retailing, banking, and others. It is a good candidate for “a canary in the coal mine”, in our case the stock market.
Berkshire is down approximately -9% from its 2022 peak but remains up +10% year-to-date. BRK’s stock price reached 200% as its shares traded above 2.618 and 2.666 for a few days before selling off. From its Covid low on March 23, 2020, to its 2022 high on March 29, 2022, BRK rallied 2 years and 6 days from trough to peak.
If BRK were to lose -20% from its peak or give back all its 2022 gain in the stock price we should prepare to sell the rally that follows if we have not done so already. Note: TTT subscribers are already safely in cash awaiting trade instructions for select alternative or inverted ETFs.
BRK.A • BERKSHIRE HATHAWAY INC. • NYSE • DAILY • TRADINGVIEW
UNDERSTANDING PRICE IS A GAME-CHANger
As technical traders, we follow price only, and when a new trend has been confirmed, we change our positions accordingly. We provide our ETF trades to subscribers. Recently, we entered new trades, all of which hit their first profit target levels and then eventually triggered their break-even profit stop-loss orders on their remaining position. After booking our profits we are now safely in cash preparing for our next trades. Our models continually track price action in a multitude of markets and asset classes as we track global money flow. As our models generate new information about trends or a change in trends, we will communicate these signals expeditiously to our subscribers and to those on our trading newsletter email list.
Sign up for my free trading newsletter so you don’t miss the next opportunity
Successful trading is not limited to when to buy or sell stocks or commodities. Money and risk management play a critical role in becoming a consistently profitable trader. Correct position sizing utilizing stop-loss orders helps preserve your investment capital and allows traders to manage their portfolios according to their desired risk parameters. Additionally, scaling out of positions by taking profits and moving stop-loss orders to breakeven can complement ones’ success.
WHAT STRATEGIES CAN HELP YOU NAVIGATE The CURRENT MARKET TRENDS?
Learn how I use specific tools to help me understand price cycles, set-ups, and price target levels in various sectors to identify strategic entry and exit points for trades. Over the next 12 to 24 months, I expect very large price swings in the US stock market and other asset classes across the globe. I believe we are seeing the markets beginning to transition away from the continued central bank support rally phase and have started a revaluation phase as global traders attempt to identify the next big trends. Precious Metals will likely start to act as a proper hedge as caution and concern start to drive traders/investors into metals, commodities, and other safe-havens.
UNDERSTAND HOW TO NAVIGATE OUR VOLATILE MARKETS!
GET READY, GET SET, GO -I invite you to learn more about how my three ETF Technical Trading Strategies can help you protect and grow your wealth in any type of market condition by clicking on the following link: www.TheTechnicalTraders.com
Have a great day!
Chris Vermeulen
www.TheTechnicalTraders.com
Chris Vermeulen has been involved in the markets since 1997 and is the founder of Technical Traders Ltd. He is an internationally recognized technical analyst, trader, and is the author of the book: 7 Steps to Win With Logic
Through years of research, trading and helping individual traders around the world. He learned that many traders have great trading ideas, but they lack one thing, they struggle to execute trades in a systematic way for consistent results. Chris helps educate traders with a three-hour video course that can change your trading results for the better.
His mission is to help his clients boost their trading performance while reducing market exposure and portfolio volatility.
He is a regular speaker on HoweStreet.com, and the FinancialSurvivorNetwork radio shows. Chris was also featured on the cover of AmalgaTrader Magazine, and contributes articles to several leading financial hubs like MarketOracle.co.uk
Disclaimer: Nothing in this report should be construed as a solicitation to buy or sell any securities mentioned. Technical Traders Ltd., its owners and the author of this report are not registered broker-dealers or financial advisors. Before investing in any securities, you should consult with your financial advisor and a registered broker-dealer. Never make an investment based solely on what you read in an online or printed report, including this report, especially if the investment involves a small, thinly-traded company that isn’t well known. Technical Traders Ltd. and the author of this report has been paid by Cardiff Energy Corp. In addition, the author owns shares of Cardiff Energy Corp. and would also benefit from volume and price appreciation of its stock. The information provided here within should not be construed as a financial analysis but rather as an advertisement. The author’s views and opinions regarding the companies featured in reports are his own views and are based on information that he has researched independently and has received, which the author assumes to be reliable. Technical Traders Ltd. and the author of this report do not guarantee the accuracy, completeness, or usefulness of any content of this report, nor its fitness for any particular purpose. Lastly, the author does not guarantee that any of the companies mentioned in the reports will perform as expected, and any comparisons made to other companies may not be valid or come into effect.
Chris Vermeulen Archive |
© 2005-2022 http://www.MarketOracle.co.uk - The Market Oracle is a FREE Daily Financial Markets Analysis & Forecasting online publication.