Winter Is About To Wake up the Natural Gas Price
Commodities / Natural Gas Nov 24, 2022 - 06:01 PM GMTAn unusually warm October has helped natural gas inventories, but gas prices don't seem to believe it. Oil has seen three days of heavy selling volume ending with a hammer candle stick Monday. Birchcliff, Callon, and Earthstone should benefit.
Gold stocks have started a new bull market. The question is, will the gold price confirm it?
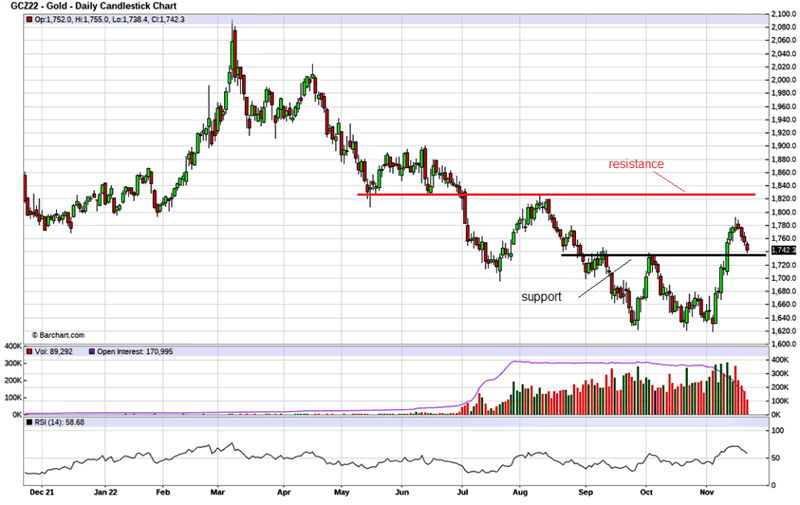
The HUI index ran from a low of 180.41 on November 3, 2022, to a high of 224.88 on November 10, 2022, which is a +24.6% move. The gold stocks often lead to a move in gold, and the gold price did move from US$1631 to US$1775 in the same time frame.
Gold broke out with a strong bullish engulfing candle stick on November 4, 2022. I commented and went into more detail in my November 3rd update that I put out at about 11:00 am on the 4th.
ESG
Right now, I am watching support around US$1730, which was the break out to a higher high. Ideally, in a bullish scenario, this holds, and we see a bounce up higher from it. The next important resistance is around US$1830.
While I believe there are strong odds a gold bottom is in, the jury is still out on how and whether a bull market develops. I am much more confident about a strong bull move with oil and gas.
The Biden Administration and Environmental Social Governance (ESG) guarantee a huge bull market in oil. I have commented plenty about Biden ending pipelines and oil and gas leases and incentives. ESG is really about not investing in oil and gas but in green energy only.
Ironically the big oil companies are investing in solar and wind to meet ESG rhetoric. BP even changed its branding name to Beyond Petroleum “We need to reinvent the energy business,” declared BP’s chief executive in a speech at Stanford University in March 2002. “We need to go beyond petroleum.” In recent years this ESG focus has intensified.
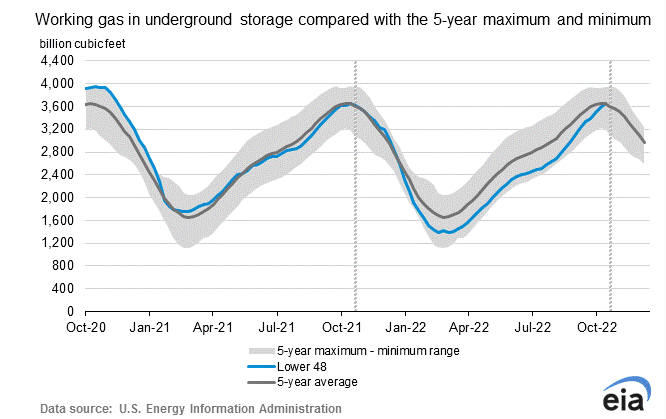
Natural Gas storage in the U.S. bounced back to the five-year average, and I believe we got a lucky break.
You probably heard plenty in the news about the recent climate summit (COP27), but I would like to make a point about how phony this is. The U.S. accounts for about 25% of the world's carbon output, and they still get almost 50% of their electricity from burning coal.
The U.S. needs to clean up its act before telling the rest of the world what to do. The Biden administration has given incentives for green energy, but they always seem to avoid this coal-burning issue.
Natural Gas Bouncing Back
Natural Gas storage in the U.S. bounced back to the five-year average, and I believe we got a lucky break.
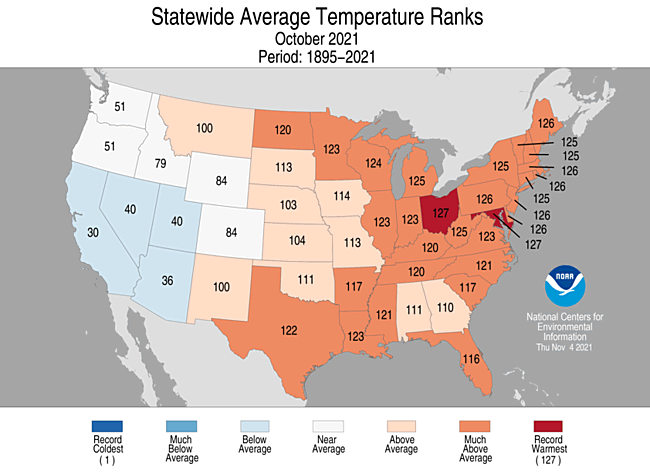
Usually, October is the early days of the heating season, and gas inventories start their seasonal decline. However, for October, the average contiguous U.S. temperature was 57.0°F, 2.9°F above the 20th-century average.
This ranked sixth warmest in the 127-year record. Notice on the map the largest users of heating fuel in the NE U.S. had abnormally warm weather. It was much the same in Ontario, Canada.
That was perhaps the good news, but as I warned, with another La Niña winter and the lowest sunspot activity in 100 years, a cold winter is likely. It arrived with a vengeance last week with record snowfalls in the U.S. and Canada. I usually watch some Sunday football, and this year the Buffalo Bills had to reschedule their home game to Detroit. Buffalo got 77 inches of snow, and it was the first time in history that a game was moved because of snow.
I expect this winter, we will see that huge gap between U.S. Henry Hub prices and European gas prices close significantly. I expect U.S. prices of US$10 to US$15.
There is a long line of well-developed storms stretching across the Pacific Ocean. Eventually, this means Michigan and the Great Lakes region will get into significant moisture.
The first two of these storms will cross the U.S. around Thanksgiving. The parade of storms will then send a full-scale storm system toward the Great Lakes about every three to five days. Depending on how they track, there can be warmer weather that is usually to the south side of the storm track.
It's up to Mother Nature.
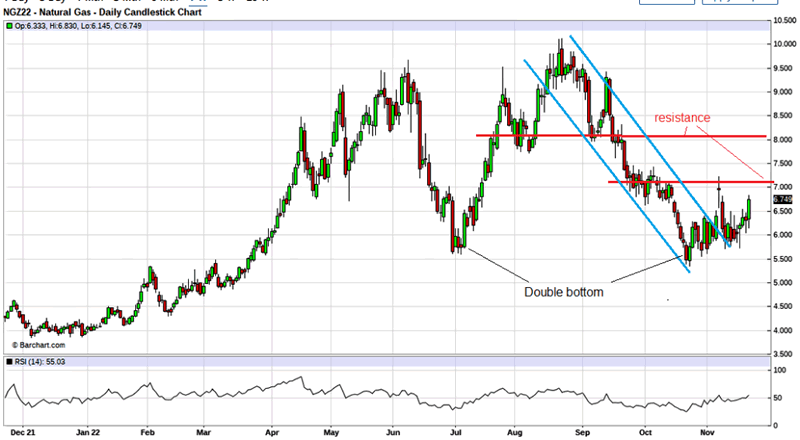
Although natural gas inventories rose, it appears gas prices are not agreeing and going higher. Perhaps the market is starting to price in winter weather, just a little late this year. On the chart, we see a strong move up on Monday, and I expect a test of resistance just over US$7 next. As I mentioned before, the downtrend channel has been broken, and we have a double bottom at around US$5.
There is not much confidence to invest in the oil and gas side. According to a recent Deloitte outlook report, in the first nine months of 2022, oil and gas merger and acquisition activity dropped -27% year over year despite oil prices averaging above US$100/bbl and the upstream industry's financial health reaching an all-time best.
They also indicate strong demand for U.S. LNG that is eventually going to positively affect U.S. Natural Gas prices.
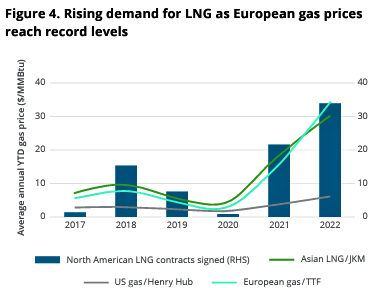
I expect this winter, we will see that huge gap between U.S. Henry Hub prices and European gas prices close significantly. I expect U.S. prices of US$10 to US$15.
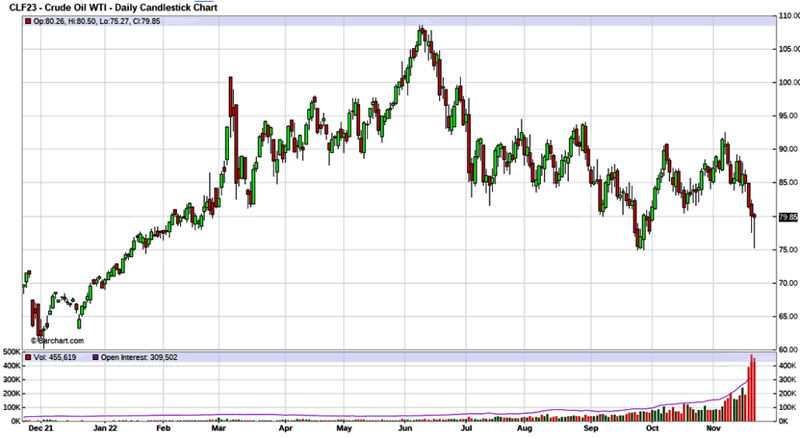
I am not going to get into much detail on the oil side other than an obvious reversal on the chart. Today and the last couple of days were a good washout bottom in the oil price. The selling in the last three days has been on high volume, and we got a hammer candle stick that hammered a bottom just above US$75 on Monday.
That was also a retest of the bottom from late September, so to me, it appears a double bottom has just been made.
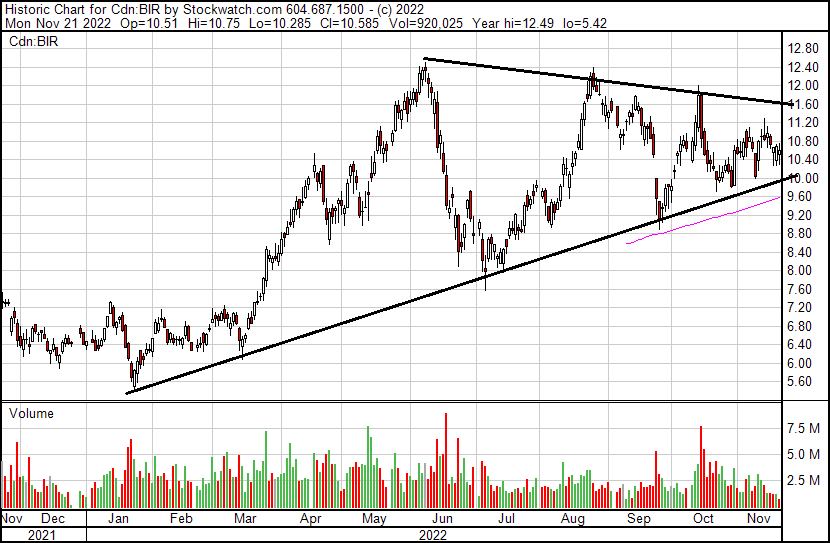
In 2023, Birchcliff is expected to deliver annual average production of 81,000 to 83,000 barrels of oil equivalent per day, a 5% increase over 2022. Although the dividend was called a special dividend, according to their October 13th press release, it will continue.
“Birchcliff is currently forecasting that it will generate adjusted funds flow of approximately $855 million and free funds flow of approximately $585 million to $615 million in 2023, based on current strip pricing. This anticipated significant free funds flow provides the corporation with the ability to sustainably increase shareholder returns. As previously disclosed, Birchcliff is currently targeting an annual common share dividend of 80 cents per share in 2023 (approximately $213 million annually), subject to commodity prices and the approval of the corporation's board of directors.”
"Birchcliff continued to deliver exceptional results in the third quarter, highlighted by average quarterly production of 78,079 barrels of oil equivalent per day, which resulted in record Q3 adjusted funds flow of $267.4-million ($1.01 per basic common share), record Q3 free funds flow of $182-million (69 cents per basic common share) and record quarterly net income to common shareholders of $244.6-million (92 cents per basic common share)," commented Jeff Tonken, chief executive officer of Birchcliff.
Birchcliff announced record quarterly results on November 9, 2022.
"Birchcliff continued to deliver exceptional results in the third quarter, highlighted by average quarterly production of 78,079 barrels of oil equivalent per day, which resulted in record Q3 adjusted funds flow of $267.4 million ($1.01 per basic common share), record Q3 free funds flow of $182 million ($0.69 per basic common share) and record quarterly net income to common shareholders of $244.6 million ($0.92 per basic common share)," commented Jeff Tonken, chief executive officer of Birchcliff.
Mr. Tonken continued: "As previously announced on Oct. 13, 2022, Birchcliff paid a special cash dividend of $0.20 per share to our common shareholders on Oct. 28, 2022. Additionally, we have commenced the execution of our 2023 capital program, which we expect will result in annual average production of 81,000 to 83,000 barrels of oil equivalent per day in 2023, a 5% increase over 2022. After the payment of Birchcliff's targeted 2023 annual common share dividend of $0.80 per share (20 cents per share quarterly), we are forecasting that we will have a cash surplus of approximately $295 million to $325 million on Dec. 31, 2023. We are maintaining our 2022 guidance and preliminary 2023 guidance that we provided on Oct. 13, 2022, and we expect to announce the details of our 2023 capital program and updated five-year plan for 2023 to 2027 on Jan. 18, 2023."
Earthstone Energy Inc. (ESTE:NYSE.MKT).Callon is trading at just 1.5 times book value and just over 1.8 times CFFO.
For unknown reasons, the stock has been underperforming in the market. I think it will play catch up now and in 2023.
With Earthstone, since my last coverage on September 27th, the news has been all great. Q3 results announced on November 2, 2022, were awesome.
Third Quarter 2022 and Other Recent Highlights:
-
Repurchase of 3 million shares of Class A Common Stock for US$43.7 million
-
Closed the Titus Acquisition on August 10, 2022
-
Net income attributable to Earthstone Energy, Inc. of US$211.5 million, or US$1.94 per Diluted Share
-
Net income of US$299.3 million, or US$2.09 per Adjusted Diluted Share
-
Adjusted net income of US$186.9 million, or US$1.30 per Adjusted Diluted Share
-
Adjusted EBITDAX of US$345.8 million, up 15% compared to 2Q 2022
-
Net cash provided by operating activities of US$365.5 million
-
Free Cash Flow of US$174.2 million, up 6% compared to 2Q 2022
-
Average net production of 94,329 Boepd, up 22% compared to 2Q 2022 and 7% above the midpoint of 3Q 2022 guidance
-
Capital expenditures of US$147.2 million
Their production increased to over 100,000 Boepd in September. On the strength of production from new wells and continued operational improvements, which resulted in exceeding their third-quarter production guidance, Earthstone is increasing its fourth-quarter production guidance to a new range of 98,000 -102,000 Boepd. Earthstone is trading about even to book value and just over two times cash flow.
The company has been on a growth spurt on steroids going from around 24 Boepd a year ago to 100 Boepd now. Using current cash flow, the stock is trading at just 1.5 times.
These oil and gas stocks would normally trade at five to 10 times cash flow. I expect these days will return once the market figures out the current energy crisis will be around much longer than is expected now.
ESTE was breaking resistance around US$17, but the recent pullback in oil has only delayed this short term.
| Want to be the first to know about interesting Oil & Gas - Exploration & Production investment ideas? Sign up to receive the FREE Streetwise Reports' newsletter. | Subscribe |
Struthers Stock Report Disclaimers:
All forecasts and recommendations are based on opinion. Markets change direction with consensus beliefs, which may change at any time and without notice. The author/publisher of this publication has taken every precaution to provide the most accurate information possible. The information & data were obtained from sources believed to be reliable, but because the information & data source are beyond the author's control, no representation or guarantee is made that it is complete or accurate.
The reader accepts information on the condition that errors or omissions shall not be made the basis for any claim, demand or cause for action. Because of the ever-changing nature of information & statistics the author/publisher strongly encourages the reader to communicate directly with the company and/or with their personal investment adviser to obtain up to date information.
Past results are not necessarily indicative of future results. Any statements non-factual in nature constitute only current opinions, which are subject to change. The author/publisher may or may not have a position in the securities and/or options relating thereto, & may make purchases and/or sales of these securities relating thereto from time to time in the open market or otherwise. Neither the information, nor opinions expressed, shall be construed as a solicitation to buy or sell any stock, futures or options contract mentioned herein. The author/publisher of this letter is not a qualified financial adviser & is not acting as such in this publication.
Disclosures:
Charts provided by the author.
1) Ron Struthers: I, or members of my immediate household or family, own shares of the following companies mentioned in this article: All. I personally am, or members of my immediate household or family are, paid by the following companies mentioned in this article: None. My company currently has a financial relationship with the following companies mentioned in this article: None. I determined which companies would be included in this article based on my research and understanding of the sector.
2) The following companies mentioned in this article are billboard sponsors of Streetwise Reports: None. Click here for important disclosures about sponsor fees. The information provided above is for informational purposes only and is not a recommendation to buy or sell any security.
3) Statements and opinions expressed are the opinions of the author and not of Streetwise Reports or its officers. The author is wholly responsible for the validity of the statements. The author was not paid by Streetwise Reports for this article. Streetwise Reports was not paid by the author to publish or syndicate this article. Streetwise Reports requires contributing authors to disclose any shareholdings in, or economic relationships with, companies that they write about. Streetwise Reports relies upon the authors to accurately provide this information and Streetwise Reports has no means of verifying its accuracy.
4) This article does not constitute investment advice. Each reader is encouraged to consult with his or her individual financial professional and any action a reader takes as a result of information presented here is his or her own responsibility. By opening this page, each reader accepts and agrees to Streetwise Reports' terms of use and full legal disclaimer. This article is not a solicitation for investment. Streetwise Reports does not render general or specific investment advice and the information on Streetwise Reports should not be considered a recommendation to buy or sell any security. Streetwise Reports does not endorse or recommend the business, products, services, or securities of any company mentioned on Streetwise Reports.
5) From time to time, Streetwise Reports LLC and its directors, officers, employees, or members of their families, as well as persons interviewed for articles and interviews on the site, may have a long or short position in the securities mentioned. Directors, officers, employees, or members of their immediate families are prohibited from making purchases and/or sales of those securities in the open market or otherwise from the time of the decision to publish an article until three business days after the publication of the article. The foregoing prohibition does not apply to articles that in substance only restate previously published company releases.
© 2005-2022 http://www.MarketOracle.co.uk - The Market Oracle is a FREE Daily Financial Markets Analysis & Forecasting online publication.


