Natural Gas UNG ETF in Completed Bottoming Formation
Commodities / Natural Gas Feb 09, 2009 - 01:19 PM GMTBy: Mike_Paulenoff

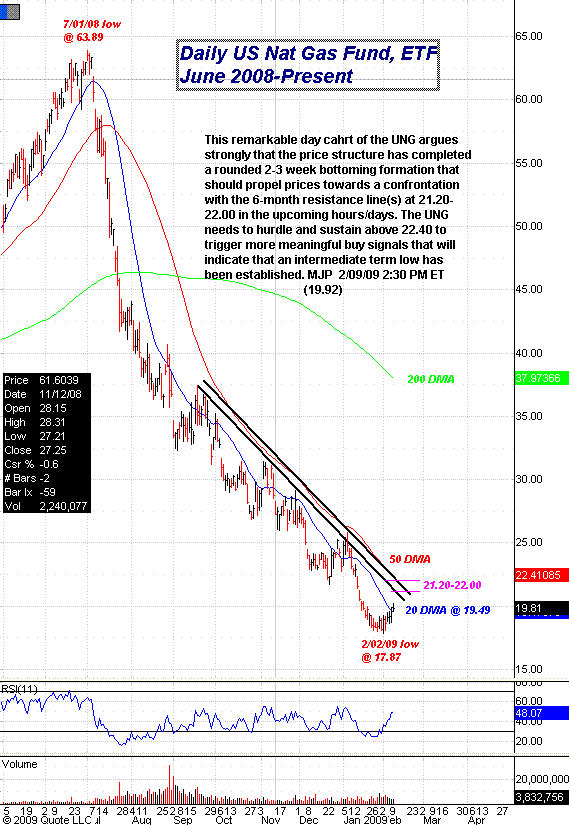
 The daily chart of the U.S. Natural Gas Fund ETF (NYSE: UNG) argues strongly that the price structure has completed a rounded 2-3 week bottoming formation that should propel prices towards a confrontation with the 6-month resistance line(s) at 21.20-22.00 in the upcoming hours/days. The UNG needs to hurdle and sustain above 22.40 to trigger more meaningful buy signals that will indicate that an intermediate-term low has been established.

Sign up for a free 15-day trial to Mike's ETF Trading Diary today.
By Mike Paulenoff
Mike Paulenoff is author of the MPTrader.com (www.mptrader.com) , a real-time diary of Mike Paulenoff's trading ideas and technical chart analysis of Exchange Traded Funds (ETFs) that track equity indices, metals, energy commodities, currencies, Treasuries, and other markets. It is for traders with a 3-30 day time horizon, who use the service for guidance on both specific trades as well as general market direction
© 2002-2009 MPTrader.com, an AdviceTrade publication. All rights reserved. Any publication, distribution, retransmission or reproduction of information or data contained on this Web site without written consent from MPTrader is prohibited. See our disclaimer.
Mike Paulenoff Archive |
© 2005-2022 http://www.MarketOracle.co.uk - The Market Oracle is a FREE Daily Financial Markets Analysis & Forecasting online publication.


