Aluminum and Natural Gas - the Next Commodities to Boom?
Commodities / Natural Gas Feb 03, 2008 - 03:53 AM GMTBy: Elliot_H_Gue
 Oil prices are up nearly 50 percent over the past year; crude prices accelerated at the end of 2007 as inventories tightened globally. Meanwhile, wheat prices are up more than 100 percent over the same time period amid strong growth in demand from the developing world, ultra-low stocks in some countries and, of course, a boom in biofuels demand powered by government subsidies.
Although wheat isn't an important feedstock for making ethanol, all agricultural commodities are affected by the biofuels boom. The reason is simply that farmers are diverting acres to corn production in an effort to capture sky-high corn prices.
But, contrary to what many investors seem to believe, not all commodities have been going up. There are several that just haven't participated fully in the recent boom. Two of the most obvious are natural gas and aluminum. In this week's issue, I'll take a more detailed look at the gas market. I've also asked my colleagues Yiannis G. Mostrous and Roger S. Conrad, co-editors of Vital Resource Investor , to offer their quick take on aluminum.
It's a Natural
As I explained in the Jan. 11 issue of The Energy Letter , Where's the Gas , natural gas prices are currently near historic lows relative to crude oil. If we assume that there are roughly 6 million British thermal units (Btu) in a barrel of oil, oil is currently trading at around $15/MMBtu. With natural gas around $8/MMBtu, it's about half the price of crude oil on an energy content basis.
The primary problem is that inventories of natural gas were far above average for most of late 2006 and all of last year. A large number of factors contributed to that overhang. Two prime factors were an extraordinarily warm winter in 2005-06 and a surge in imports of liquefied natural gas (LNG) last spring.
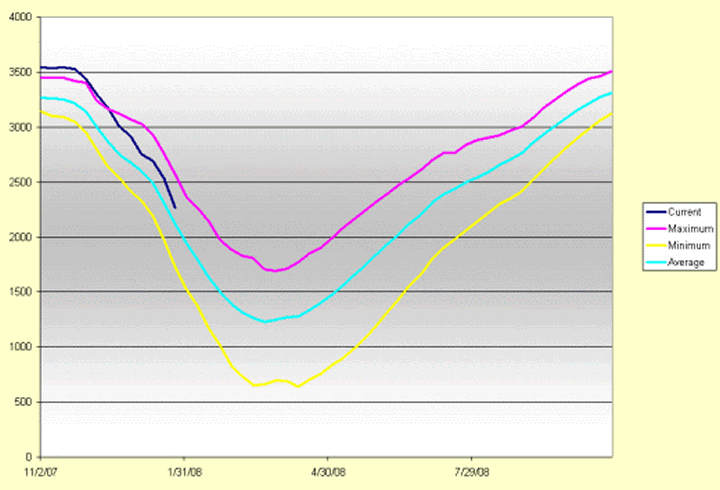
But there are signs of a shift, particularly after this week's 274-billion-cubic-foot inventory drawdown in the US. Check out the chart of US natural gas inventories below.

Source: Bloomberg , Energy Information Administration (EIA)
The dark blue line in the chart shows US natural gas inventories from the beginning of November 2007 through to the most recent report. The other three lines show the normal range of inventories based on the past five years worth of data. The purple line represents the five-year maximum inventory level, the light blue line represents the five-year average and the yellow line represents the five-year minimum.
The chart shows that gas inventories were above the five-year maximum line in early November; that glut of gas helped keep prices depressed. But as the winter heating season in North America kicked off that month, gas inventories started to draw down at a faster-than-normal pace. As of this week's report, US gas inventories are well below that maximum level and only about 3.9 percent above the five year average. Although still above average, inventories have moderated meaningfully in the past few weeks.
Also, consider the regional data on inventories. In the western US, inventories are actually 3.7 percent below average for this time of year. And in the consuming east, the nation's most important gas-consuming region, inventories are less than 3 percent above average. A bout of warm weather could change this picture somewhat, but the bottom line is that inventories are much healthier than they were just a few weeks ago.
Last Friday, on our multi-contributor blog At These Levels ( www.attheselevels.com ), I posted a detailed look at the factors influencing LNG imports into the US market. See that post entitled Gas Prices and LNG for details. To summarize: US imports of LNG depend heavily on relative prices on both sides of the Atlantic.
Last spring, US natural gas prices were far higher than prices in Europe, as measured by the London-traded gas contract. At one point, gas prices in the US were more than double what was available in the EU. Producers with LNG for sale sent as much as possible to US shores to take advantage of those attractive relative prices. The surge in LNG imports sent US inventories sharply higher and again hit gas prices.
But that situation has now reversed. At this time, gas trades for about 49 British pence (GBP0.49) per therm (equivalent to 100,000 Btus). That works out to about $9.80/MMBtus, a more than 20 percent premium to gas in the US. Meanwhile, London-traded gas has been relatively stable in a range between 45 pence and 55 pence per therm since mid-October. With gas prices higher in London, the US isn't going to see a flood of LNG imports any time soon. In fact, as you can see on the blog , LNG imports have completely cratered lately.
Another factor to keep an eye on is Canadian drilling activity. Over the past two weeks, I've been wading through a veritable deluge of earnings reports and conference calls from companies in the oil and gas business. There's one commonality between the calls: The Canadian market is extremely weak right now.
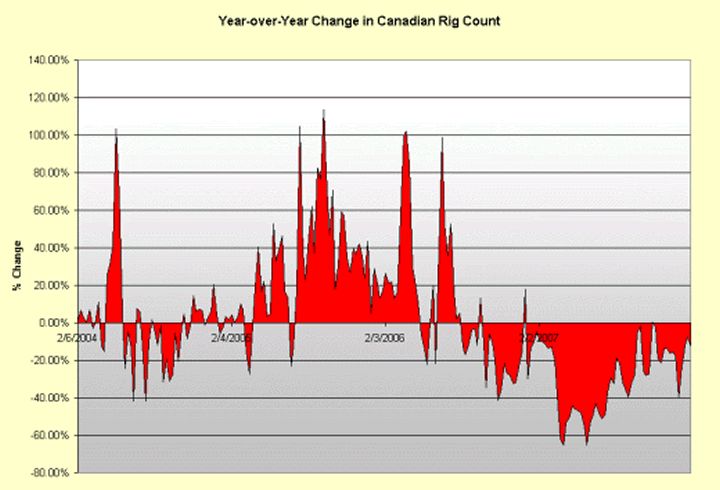
Falling gas prices were enough to impact drilling activity on their own. And the Canadian government's decision to change their tax system certainly has exacerbated the problem. At any rate, check out the chart of the year-over-year rate of change in the Canadian active rig count.

![]()
Source: Bloomberg , Baker Hughes
The active rig count is a measure of how many drilling rigs are operating in a particular market. When the rig count is high and rising, it's a sign of high levels of drilling activity. When it's falling, that's a sign that activity is moderating.
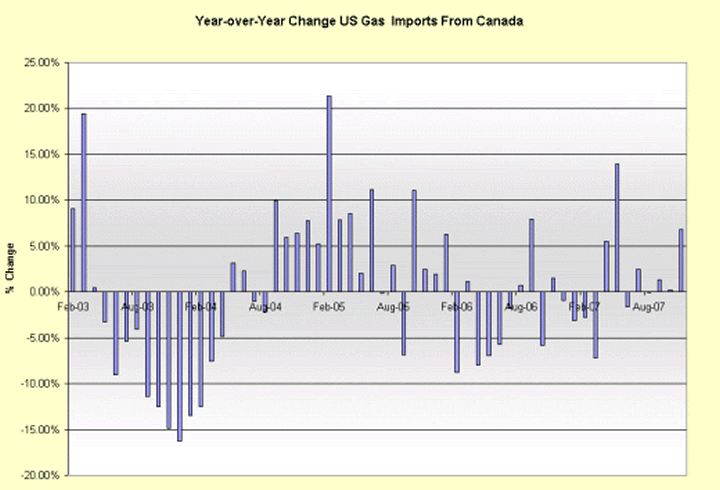
The chart shows the year-over-year change in the Canadian rig count. It's clear that activity there isn't just moderating, it's cratering. Ultimately, falling activity spells falling production and falling production means falling exports to the US. Check out the chart of US imports of Canadian gas below.

Source: EIA
Like the chart of the rig count above, this chart shows the year-over-year change in US gas imports from Canada. Note that for most months in late 2006 and throughout 2007, imports were lower on a year-over-year basis.
In fact, the only reason that we have seen a few spikes in recent months is that the comparable year-ago period (late 2006) was so extraordinarily weak. In other words, the comparisons are getting easier.
My bottom line on gas is simple: The inventory picture remains mildly bearish. However, the headwinds aren't as big as late 2006 and early 2007. The trends in LNG imports, European gas prices and Canadian drilling activity also will tend to support inventory moderation and higher prices over the next 12 months. There are also a number of one-off factors that could send prices soaring, notably an active 2008 Atlantic hurricane season or another vicious cold snap in the Northeast US.
I expect gas drilling activity to stabilize in North America this year. I also expect prices to stabilize to average in the $8/MMBtu to $9/MMBtu for 2008 as a whole. This stabilization will be enough to send gas-levered services and production firms--long major laggards--sharply higher this year.
In short, I see value in natural gas. And because traders don't have huge profits to protect in these stocks, the gas-levered names just aren't as sensitive to the stock market volatility that we've witnessed over the past month.
Aluminum
Just like gas, I see value in aluminum. A few months ago, my colleagues Yiannis Mostrous and Roger Conrad penned a piece for TEL outlining their bullish case for the market. This week, they've kindly offered a brief review.
I encourage all readers to check out their take on this undervalued and potentially explosive market.
The Secret Metal
By Yiannis Mostrous and Roger Conrad
Aluminum is the only base metal that hasn't substantially increased in price during the commodities boom of the last two years. As we've pointed out, one of the reasons is overproduction in China, which is now moving to shut down inefficient producers by eliminating subsidies. This remains a work in progress, but we're still on track for higher prices going forward as only economic producers survive.
The other side of the equation is Chinese consumption, which looks to stay strong as the country embarks on a new round of massive infrastructure and urbanization projects. In addition, industry reports are indicating that China may become a net importer of Aluminum in 2008, and it adds up to a huge opportunity in a still-depressed market.
According to industry sources, the transportation sector will be very supportive for aluminum prices in 2008. The construction sector will be strong in emerging markets, especially China, Russia, and the Middle East, offsetting weakness in North America. The aluminum market is turning, and we do have the play that will benefit the most from this turn.
By Elliott H. Gue
The Energy Letter
© 2008 Elliott H. Gue
Elliott H. Gue is editor of The Energy Letter , a bi-weekly e-letter as well as editor of The Energy Strategist , a premium bi-weekly newsletter on the energy markets. Mr. Gue is also associate editor for Personal Finance , where he contributes his knowledge of the energy markets.
Mr. Gue has a Master's of Finance degree from the University of London and a Bachelor of Science degree in Economics and Management from the University of London , graduating in the top 3 percent of his class. Mr. Gue was the first American student to ever complete a full degree at that university.
Elliott H. Gue Archive |
© 2005-2022 http://www.MarketOracle.co.uk - The Market Oracle is a FREE Daily Financial Markets Analysis & Forecasting online publication.


