


Anatomy Of A Treasury Bond Market Top
Interest-Rates / US Bonds Jun 10, 2009 - 01:12 PM GMTBy: Guy_Lerner

 One of the major themes that I have been highlighting on this blog since its inception 6 months ago is the potential for a secular trend change in long term Treasury bonds. Starting back in December, 2008, there was a high likelihood of higher yields and lower bond prices. Last month provided technical confirmation that the top is in for Treasury bonds, and we should see yield pressures in the long end of the curve lasting at least 12 months.
There are a lot of fundamental reasons out there why we should see lower yields, and these include (but not limited to): 1) we are still in a recession; 2) lackluster growth despite second derivative improvement in "the indicators"; 3) unemployment has yet to peak; 4) inflation is low; 5) Fed intervention is highly probable; 6) sovereign wealth funds (i.e., China) are still buying our debt. Nonetheless, yields continue to rise. My theory is that we are starting at such an artificially low level that the coil has been set, and yields are moving higher to reflect a new equilibrium. I think this new equilibrium is the start of a new secular trend that will see higher yields.
Figure 1 is a monthly chart of the 10 year Treasury bond. The pink markers on the price bars are negative divergence bars between price and an oscillator that measures price momentum. Multiple negative divergence bars over time is the first sign of a market top. Then we couple this with a break below the negative divergence bar and the simple 10 month moving average, and we get confirmation of a market top.
Figure 1. 10 Year Treasury Bond/ monthly
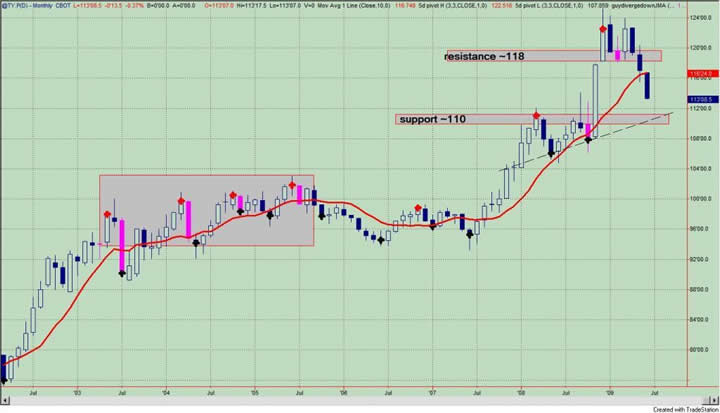
See the mini - market top in bonds from July, 2003 to July, 2005 that is highlighted in the shaded rectangle. There are multiple negative divergences and several whipsaws above and below the simple 10 month moving average. Bonds did absolutely nothing during this time period and eventually sold off.
Returning to the current set up or time period, real disaster for the 10 year Treasury bond will be a break below the rising trend line which is now at 110. This is support. Resistance is the low of the negative divergence bar and soon to be rolling over simple 10 month moving average. This is at 118.
Make no mistake about it, this is a major top for Treasury bonds. How much downside there will be is yet to be determined.
By Guy Lerner
http://thetechnicaltakedotcom.blogspot.com/
Guy M. Lerner, MD is the founder of ARL Advisers, LLC and managing partner of ARL Investment Partners, L.P. Dr. Lerner utilizes a research driven approach to determine those factors which lead to sustainable moves in the markets. He has developed many proprietary tools and trading models in his quest to outperform. Over the past four years, Lerner has shared his innovative approach with the readers of RealMoney.com and TheStreet.com as a featured columnist. He has been a regular guest on the Money Man Radio Show, DEX-TV, routinely published in the some of the most widely-read financial publications and has been a marquee speaker at financial seminars around the world.
© 2009 Copyright Guy Lerner - All Rights Reserved
Disclaimer: The above is a matter of opinion provided for general information purposes only and is not intended as investment advice. Information and analysis above are derived from sources and utilising methods believed to be reliable, but we cannot accept responsibility for any losses you may incur as a result of this analysis. Individuals should consult with their personal financial advisors.
Guy Lerner Archive |
© 2005-2022 http://www.MarketOracle.co.uk - The Market Oracle is a FREE Daily Financial Markets Analysis & Forecasting online publication.