


Still waiting for SPX uptrend to kick off
Stock-Markets / Stock Markets 2016 Oct 22, 2016 - 06:00 PM GMTBy: Tony_Caldaro

 Another choppy week. The week started at SPX 2133. After a decline on Monday to SPX 2124 the market rallied to 2148 by Wednesday. Then monthly options expiration kicked in and the market declined to SPX 2130 by Friday. For the week the SPX/DOW were +0.25%, and the NDX/NAZ were +0.85%. Economic reports were mixed. On the downtick: the NY FED, capacity utilization, the NAHB, the WLEI, housing starts, plus weekly jobless claims were higher. On the uptick: industrial production, the CPI, building permits, existing home sales, the Philly FED, and the Q3 GDP est. Next week’s reports will be highlighted by Q3 GDP, durable goods orders and more housing reports. Best to your week!
LONG TERM: uptrend
The long term trend remains unchanged: up from February 2016. We continue to label the March 2009 low as the end of a Super cycle bear market. The five waves up to May 2015 ended a Primary wave I bull market. Then the three wave decline into February 2016 ended a Primary wave II bear market. A Primary III bull market, of the five primary wave Cycle [1], began at that time.
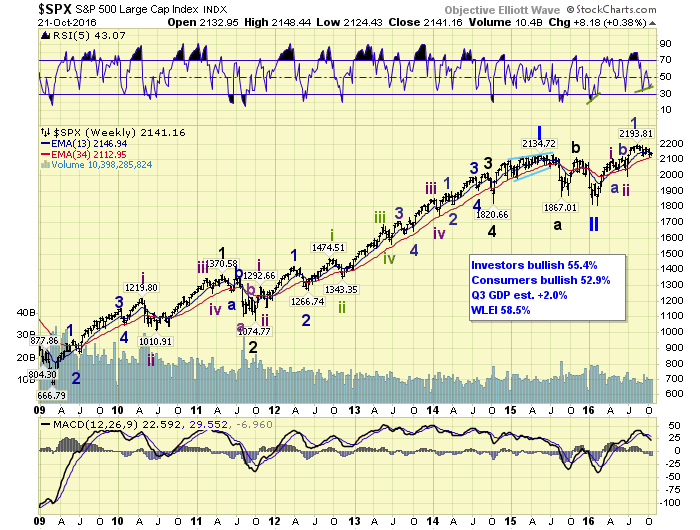
For a number of years we had been tracking, on a weekly basis, the WLEI. This is a leading economic indicator offered by the ECRI. Earlier this year we put it aside and started following the Atlanta FED Quarterly GDP estimates. With estimates again coming in around 2% GDP growth we decided to revisit the WLEI. Four weeks ago this leading index recorded its highest projected growth level in nearly 6 1/2 years, May 2010. Growth then was in the 3% to 4% zone. This indicator suggests a pickup in economic growth will likely occur in 2017. We will offer the weekly reading again on the SPX weekly chart.
MEDIUM TERM: downtrend may have bottomed
In last week’s update we noted the SPX 2115 low on October 13th fit the potential completion of the complex flat correction we had been tracking for about two months. There were positive divergences on several timeframes, and the market rallied strongly off that low on Friday the 14th to SPX 2149. Then after a pullback to SPX 2124 this Monday the advance stalled, as the two rallies off that low were both weaker than the initial surge.
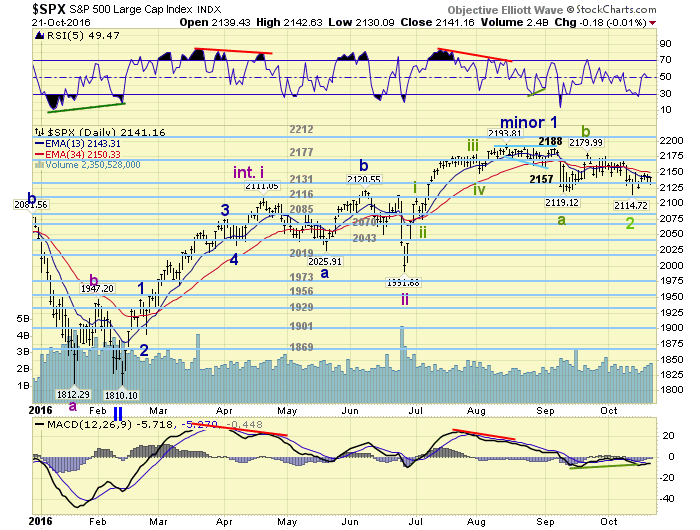
While the cyclical SPX/DOW/NYSE have not been able to get much going to the upside in two months. The growth sector NDX/NAZ/SOX have been in confirmed uptrends for some time. The last two times, small sample, the SPX/NDX were out of sync for a similar period the resolution was to the upside. We continue to favor that scenario. Medium term support is at the 2131 and 2116 pivots, with resistance at the 2177 and 2212 pivots.
SHORT TERM
We have been tracking the downtrend in the SPX as a double three, taking the form of a complex flat. The first decline from the SPX 2194 high was: 2157-2188-2119. Then after a counter rally to SPX 2180, the market declined: 2142-2175-2115. We had observed that the first decline was: 37-31-69 points, and the second: 38-33-60 points. Notice how similar the smaller wave movements were.
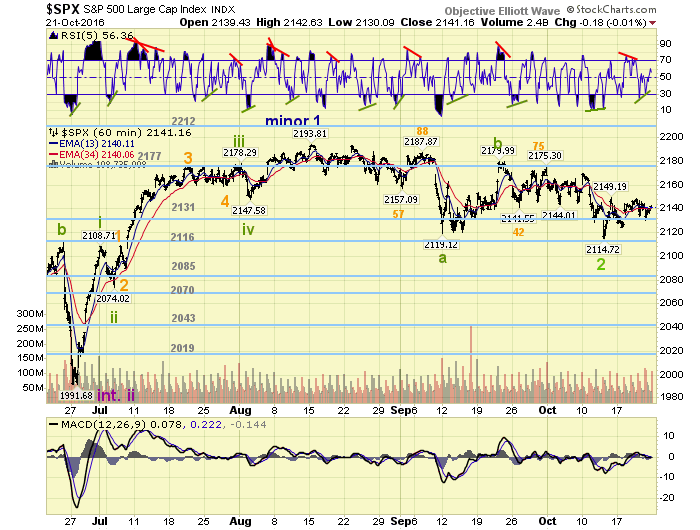
From the SPX 2115 low the market rallied to 2149. Then after a pullback to SPX 2124, the market rallied to 2148. On Friday the SPX hit a low of 2130, and then rallied. We now have four waves off the SPX 2115 low: 2149-2124-2148-2130. What is needed now is a breakout above the SPX 2149 level to keep the potential uptrend scenario intact. A breakdown below the SPX 2124 level would suggest the downtrend is still unfolding. Short term support is at the 2131 and 2116 pivots, with resistance at the mid-2140’s and low-2150’s. Short term momentum ended the week at neutral. Best to your trading!
FOREIGN MARKETS
Asian markets were mostly higher for a net gain of 0.8%.
European markets were mostly higher for a net gain of 1.5%.
The Commodity equity group were all higher gaining 2.2%.
The DJ World index gained 0.7%.
COMMODITIES
Bonds continue to downtrend but gained 0.4%.
Crude continues to uptrend and gained 0.2%.
Gold is downtrending but gained 1.0%.
The USD is uptrending and gained 0.7%.
NEXT WEEK
Tuesday: Case-Shiller, FHFA housing and consumer confidence. Wednesday: new home sales. Thursday: weekly jobless claims, durable goods orders and pending home sales. Friday: Q3 GDP and consumer sentiment.
CHARTS: http://stockcharts.com/public/1269446/tenpp
After about 40 years of investing in the markets one learns that the markets are constantly changing, not only in price, but in what drives the markets. In the 1960s, the Nifty Fifty were the leaders of the stock market. In the 1970s, stock selection using Technical Analysis was important, as the market stayed with a trading range for the entire decade. In the 1980s, the market finally broke out of it doldrums, as the DOW broke through 1100 in 1982, and launched the greatest bull market on record.
Sharing is an important aspect of a life. Over 100 people have joined our group, from all walks of life, covering twenty three countries across the globe. It's been the most fun I have ever had in the market. Sharing uncommon knowledge, with investors. In hope of aiding them in finding their financial independence.
Copyright © 2016 Tony Caldaro - All Rights Reserved Disclaimer: The above is a matter of opinion provided for general information purposes only and is not intended as investment advice. Information and analysis above are derived from sources and utilising methods believed to be reliable, but we cannot accept responsibility for any losses you may incur as a result of this analysis. Individuals should consult with their personal financial advisors.
Tony Caldaro Archive |
© 2005-2022 http://www.MarketOracle.co.uk - The Market Oracle is a FREE Daily Financial Markets Analysis & Forecasting online publication.